Fig. 5.
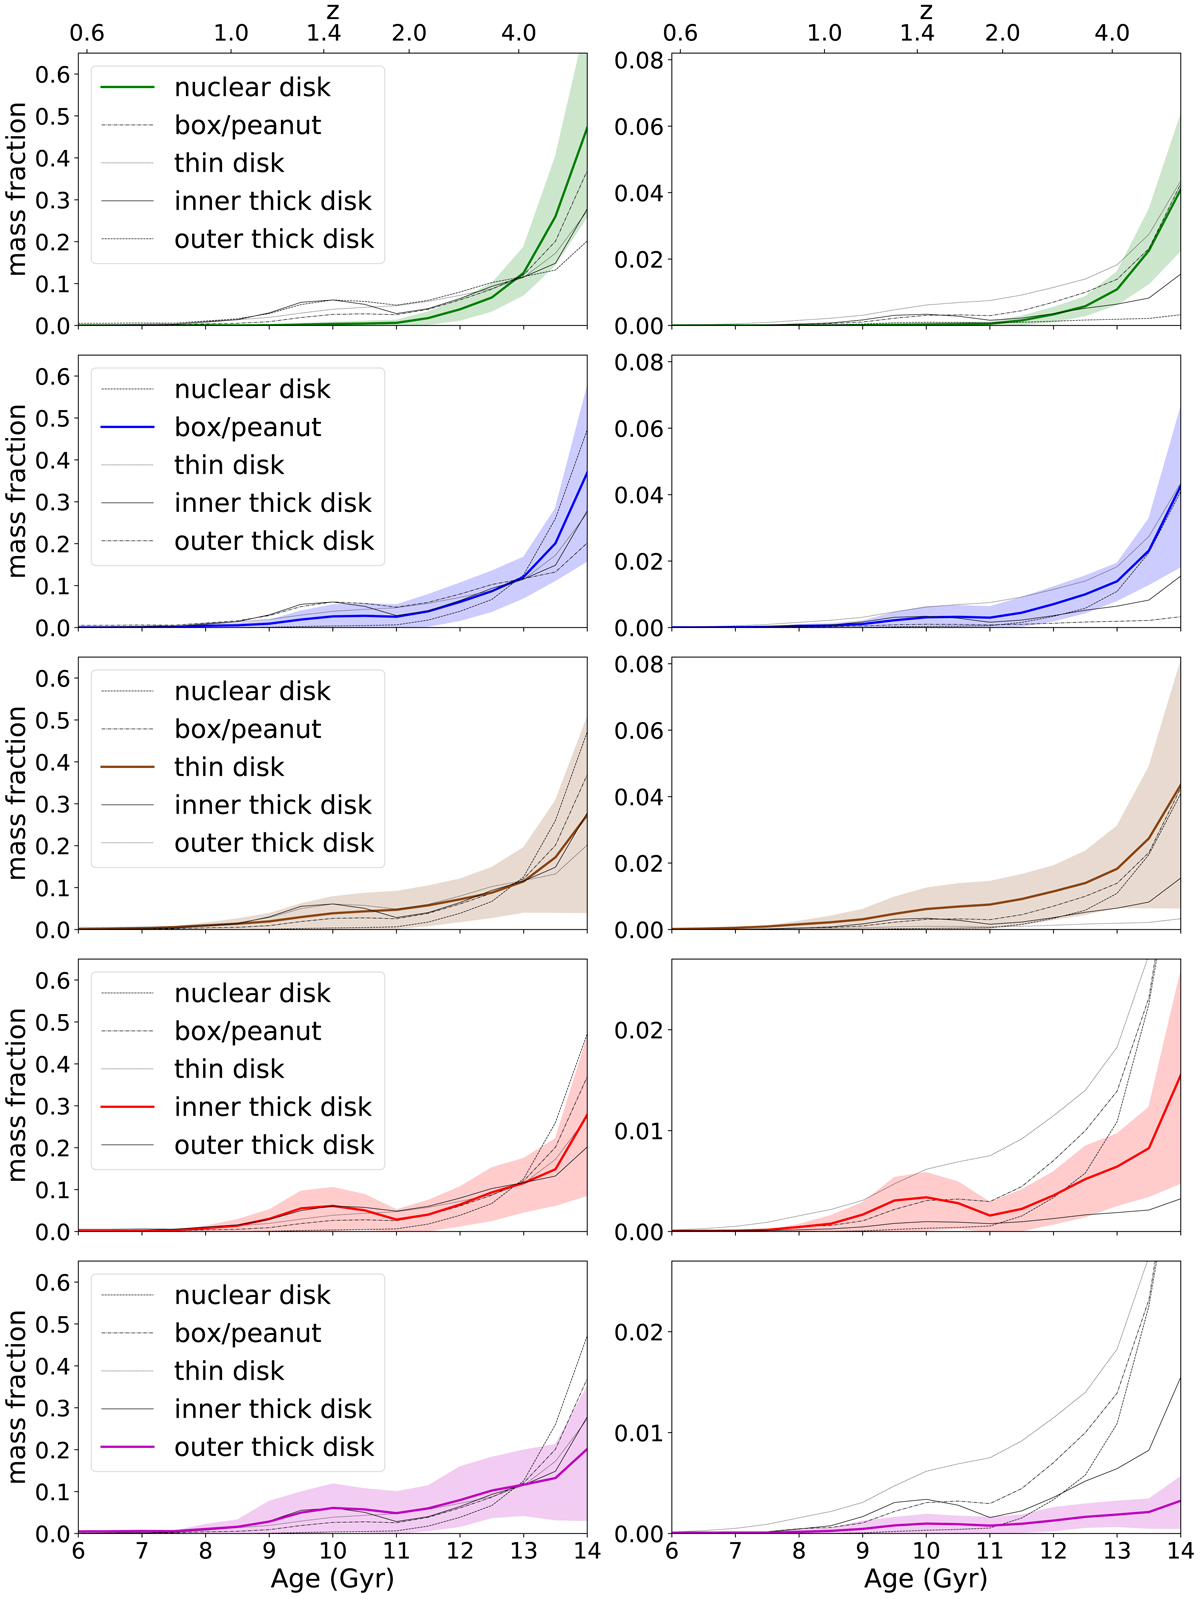
Weighted average SFH of the different structural components of FCC 170, as defined in Fig. 4. The average mass fraction is displayed on the vertical axis, weighted by the mass in each bin. This mass fraction is normalized to the total mass of the component, in the left column, and to the total mass of the galaxy, in the right column. In each panel, only one component is represented in a specific color (green for the nuclear disk, blue for the box/peanut, brown for the thin disk, and red and purple respectively for the inner and the outer thick disk). For this component, 1σ uncertainties, calculated as 16% and 84% percentiles of the spatial-bin distribution, are represented as shades of the same color. The SFH of the rest of components are plotted in black, with different line styles, in each panel. As reference, the redshift scale on top of each column indicates the epoch when stars of a given age were born. The correspondence between redshift and age was approximated with Eq. (2) in Carmeli et al. (2006).
Current usage metrics show cumulative count of Article Views (full-text article views including HTML views, PDF and ePub downloads, according to the available data) and Abstracts Views on Vision4Press platform.
Data correspond to usage on the plateform after 2015. The current usage metrics is available 48-96 hours after online publication and is updated daily on week days.
Initial download of the metrics may take a while.