Fig. 4.
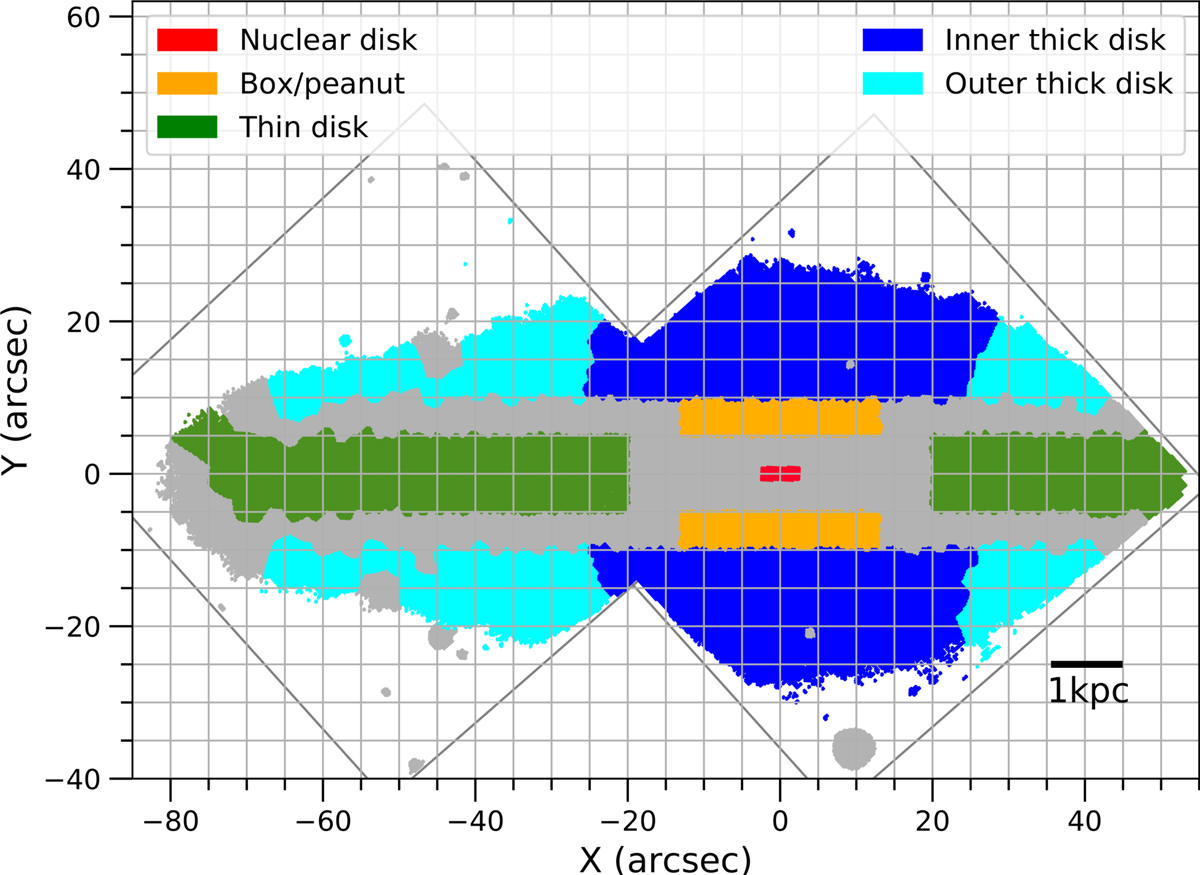
Map of the structural decomposition used in this work. Each color corresponds to a different component. The thick disk is divided into inner and outer regions. We plotted in gray all the bins not taken into account for the analysis of the single components, as well as the position of the two MUSE pointings. A scale bar on bottom-right indicates the correspondence with physical units.
Current usage metrics show cumulative count of Article Views (full-text article views including HTML views, PDF and ePub downloads, according to the available data) and Abstracts Views on Vision4Press platform.
Data correspond to usage on the plateform after 2015. The current usage metrics is available 48-96 hours after online publication and is updated daily on week days.
Initial download of the metrics may take a while.