Fig. B.2.
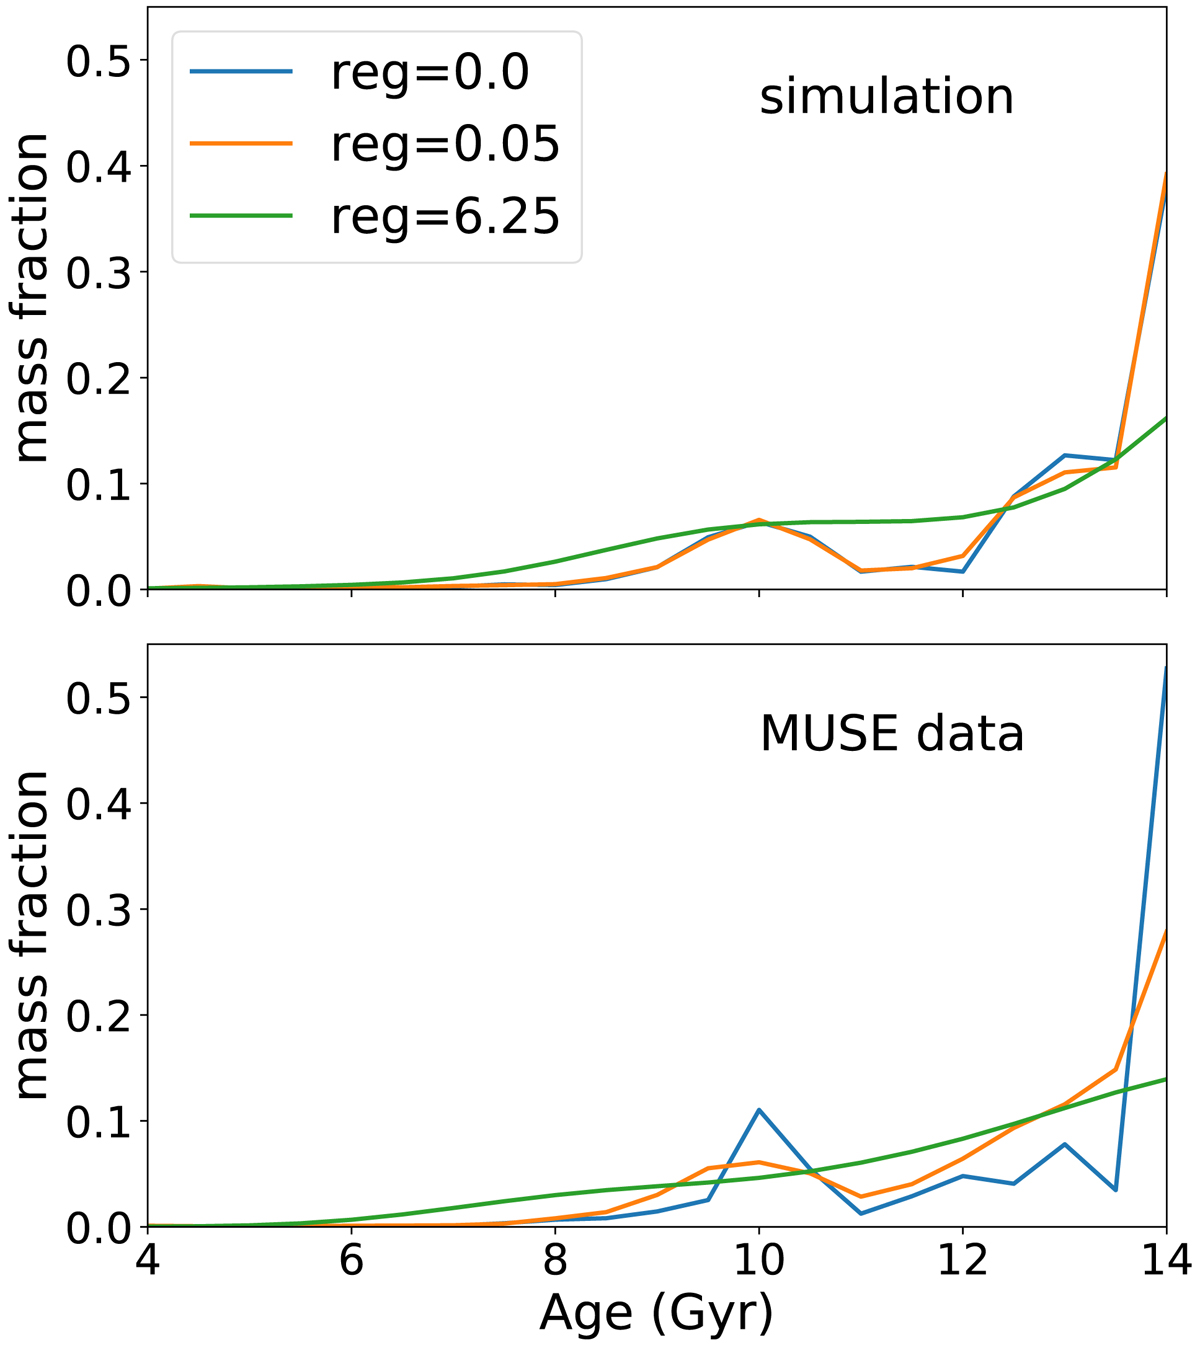
Comparison of the resulting SFH using three levels of regularization. Top panel: resulting average SFH from a mock spectrum, perturbed 1000 times with S/N = 40, mimicking the SFH found in the thick disk (Fig. 5). It is the composition of two 10 and 14 Gyr [Mg/Fe]-enhanced SSPs, of different metallicity. Bottom panel: average SFH from MUSE data of the thick-disk spatial bins. In both panels, three different regularizations were used.
Current usage metrics show cumulative count of Article Views (full-text article views including HTML views, PDF and ePub downloads, according to the available data) and Abstracts Views on Vision4Press platform.
Data correspond to usage on the plateform after 2015. The current usage metrics is available 48-96 hours after online publication and is updated daily on week days.
Initial download of the metrics may take a while.