Fig. A.1.
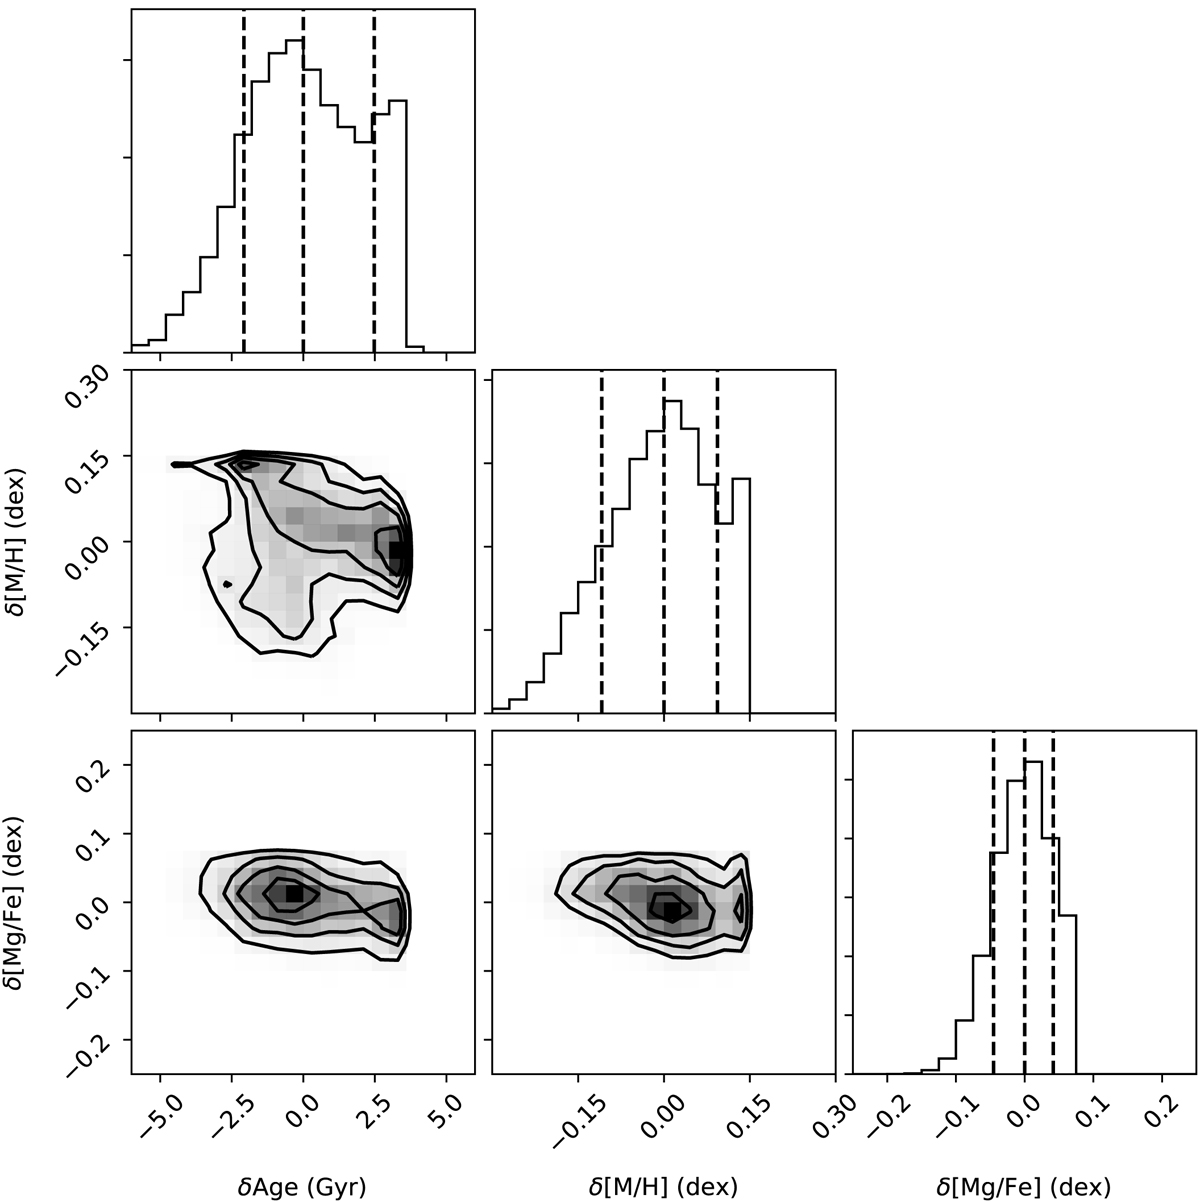
Corner plot of uncertainties of age, [M/H] and [Mg/Fe] for a spatial bin with S/N ∼ 40. The plotted 1σ-uncertainty distributions result from fitting with pPXF 10 000 Monte Carlo perturbations of the observed spectrum, with 2 different multiplicative polynomials and 3 different regularization parameters. These uncertainties were calculated as the difference between the (weighted-average) individual values of age, [M/H] or [Mg/Fe] and the median value of all the 60 000 fits.
Current usage metrics show cumulative count of Article Views (full-text article views including HTML views, PDF and ePub downloads, according to the available data) and Abstracts Views on Vision4Press platform.
Data correspond to usage on the plateform after 2015. The current usage metrics is available 48-96 hours after online publication and is updated daily on week days.
Initial download of the metrics may take a while.