Free Access
Fig. 10.
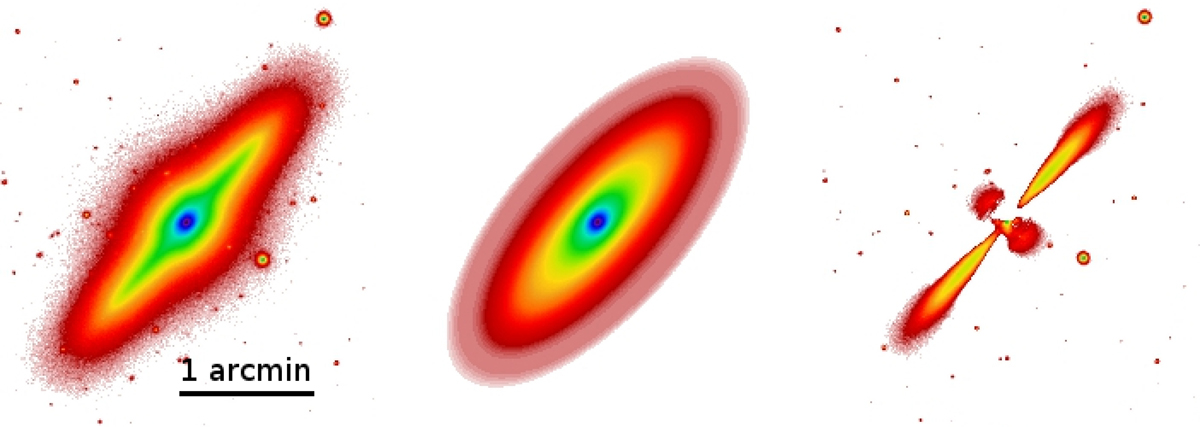
Isophotal analysis for FCC 170 in the r-band from (Iodice et al. 2019; Fig. 14). From left to right panels: data from the FDS (Iodice et al. 2016), bi-dimensional model and residual image. The latter was obtained subtracting the model from the data and clearly shows the thin disk flaring.
Current usage metrics show cumulative count of Article Views (full-text article views including HTML views, PDF and ePub downloads, according to the available data) and Abstracts Views on Vision4Press platform.
Data correspond to usage on the plateform after 2015. The current usage metrics is available 48-96 hours after online publication and is updated daily on week days.
Initial download of the metrics may take a while.