Fig. 1.
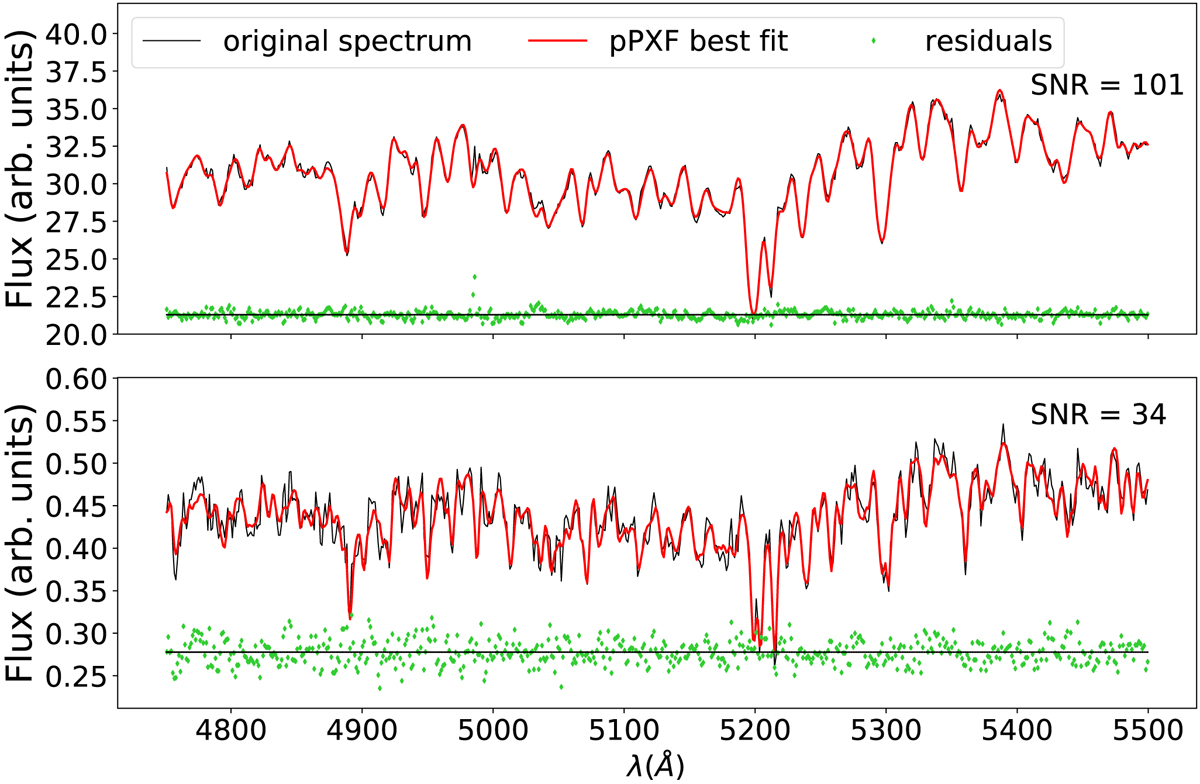
Examples of two pPXF fits in the wavelength range between 4750 and 5500 Å. Top panel: the bin with the highest S/N (S/N = 101). Bottom panel: a bin with S/N = 34. The observed spectrum, the best fit and the residuals of the fit are plotted in black, red and green, respectively. The residuals are arbitrarily shifted for displaying purposes.
Current usage metrics show cumulative count of Article Views (full-text article views including HTML views, PDF and ePub downloads, according to the available data) and Abstracts Views on Vision4Press platform.
Data correspond to usage on the plateform after 2015. The current usage metrics is available 48-96 hours after online publication and is updated daily on week days.
Initial download of the metrics may take a while.