Fig. 9.
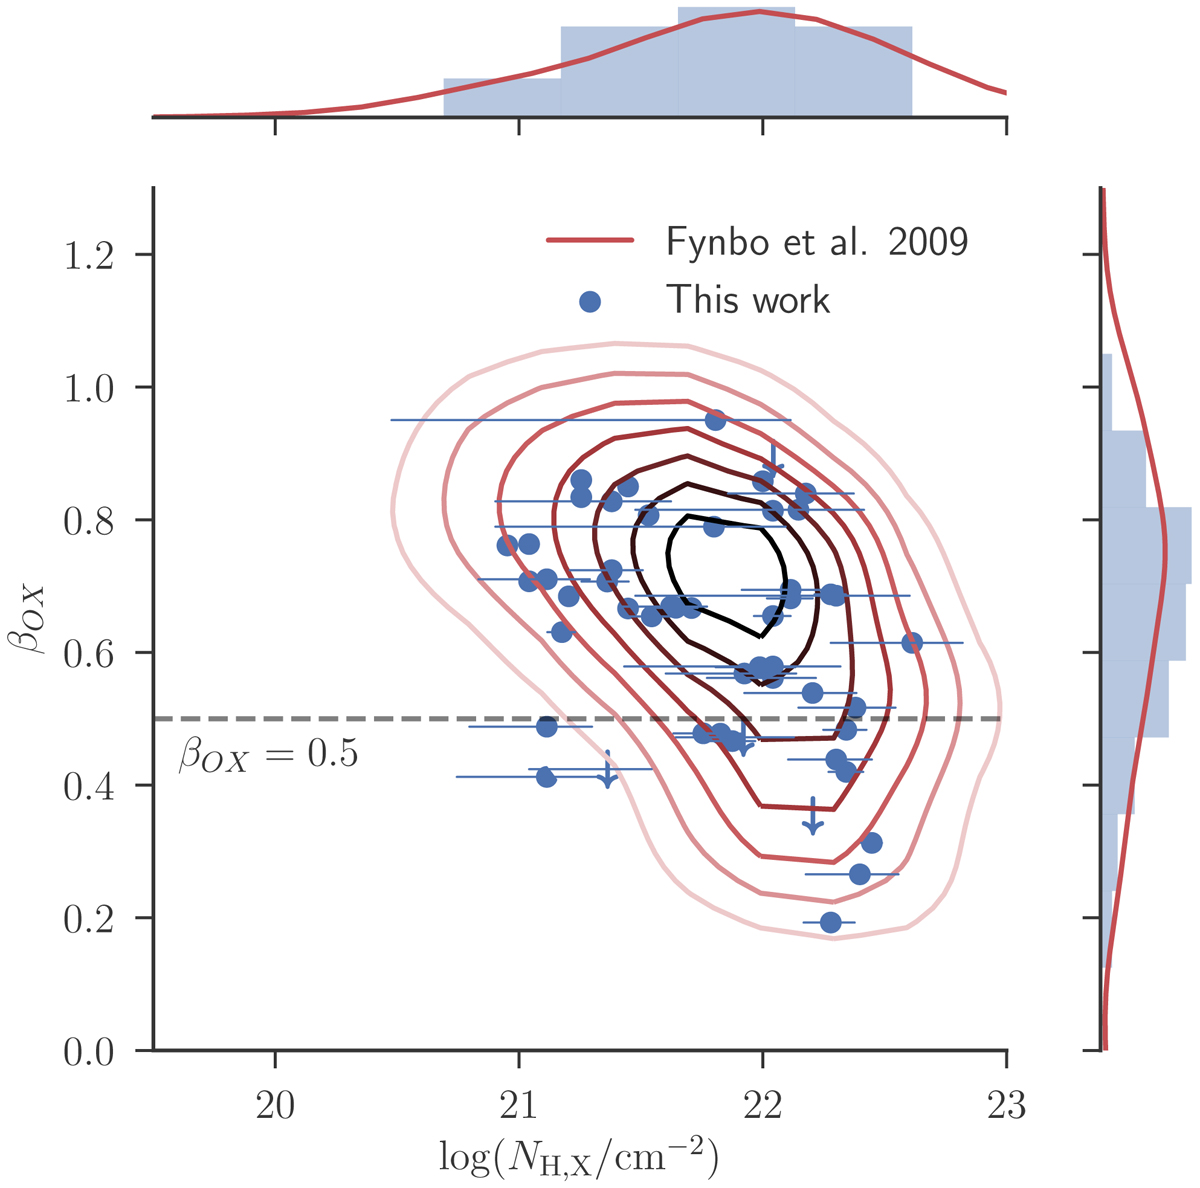
βOX against X-ray derived hydrogen column density. In red is shown the sample presented in Fynbo et al. (2009) where the lines indicate the kernel density estimate of the distribution. For the kernel density estimate, the limits have been replaced with values. We note that contrary to what is presented in Fynbo et al. (2009), we exclude all bursts for which we do not have a redshift. Darker colours represent a higher density of points. In blue are the points for the bursts presented here along with the marginal histograms. Limits on βOX are shown by downwards facing arrows. The corresponding marginal distributions are shown along the edges of the plot. A Kendall’s τ test, indicates a statistically significant, low degree of negative correlation (Γ = −0.21 at a p-value = 0.01).
Current usage metrics show cumulative count of Article Views (full-text article views including HTML views, PDF and ePub downloads, according to the available data) and Abstracts Views on Vision4Press platform.
Data correspond to usage on the plateform after 2015. The current usage metrics is available 48-96 hours after online publication and is updated daily on week days.
Initial download of the metrics may take a while.