Fig. 8.
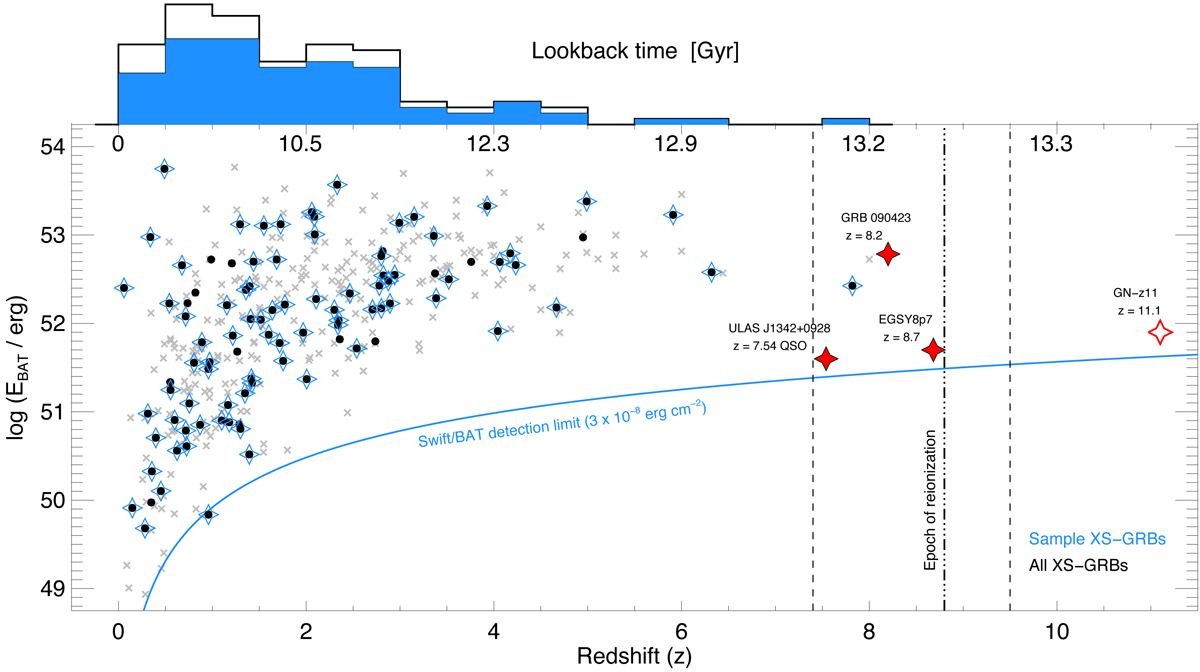
Redshift distribution as a function of intrinsic BAT γ-ray energy, EBAT. Bursts that are a part of the statistical sample are marked by blue stars whereas black dots show all GRBs observed with X-shooter. All Swift GRBs with measured redshifts are shown in grey. For comparison, we overplot with red stars the GRB (Tanvir et al. 2009; Salvaterra et al. 2009), quasar (Bañados et al. 2017), and galaxies (Zitrin et al. 2015; Oesch et al. 2016) with the highest spectroscopically confirmed redshifts, the latter three shown at arbitrary EBAT. The blue solid line represents the so-called 1 s BAT sensitivity limit described in the text. The estimated epoch of reionization is shown by the black dot-dashed line, with the uncertainty shown as the black dashed lines, from the most recent measurement by Planck Collaboration XIII (2016). On the top of the plot is shown the marginalization of the redshift. Again the blue histogram represents the bursts than enter our sample and the white histogram the full GRB population.
Current usage metrics show cumulative count of Article Views (full-text article views including HTML views, PDF and ePub downloads, according to the available data) and Abstracts Views on Vision4Press platform.
Data correspond to usage on the plateform after 2015. The current usage metrics is available 48-96 hours after online publication and is updated daily on week days.
Initial download of the metrics may take a while.