Fig. 7.
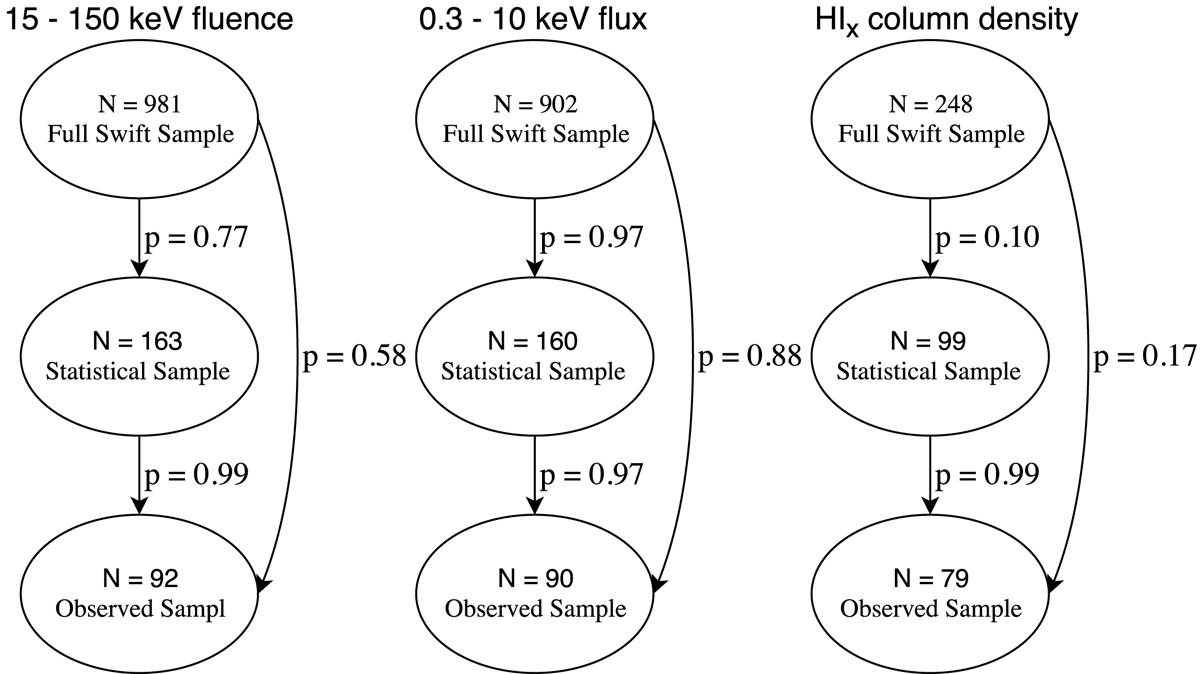
Relational graph showing the respective p-values. They all represent the degree that the different samples are drawn from the same underlying distribution. The arrows represent the comparison direction with each of the p-values they are listed next to. Only in the HI column density distribution is there mild evidence against the null hypothesis, but the discrepancy is mainly driven by a relatively larger fractional contribution from low-column hosts in the statistical sample.
Current usage metrics show cumulative count of Article Views (full-text article views including HTML views, PDF and ePub downloads, according to the available data) and Abstracts Views on Vision4Press platform.
Data correspond to usage on the plateform after 2015. The current usage metrics is available 48-96 hours after online publication and is updated daily on week days.
Initial download of the metrics may take a while.