Fig. 5.
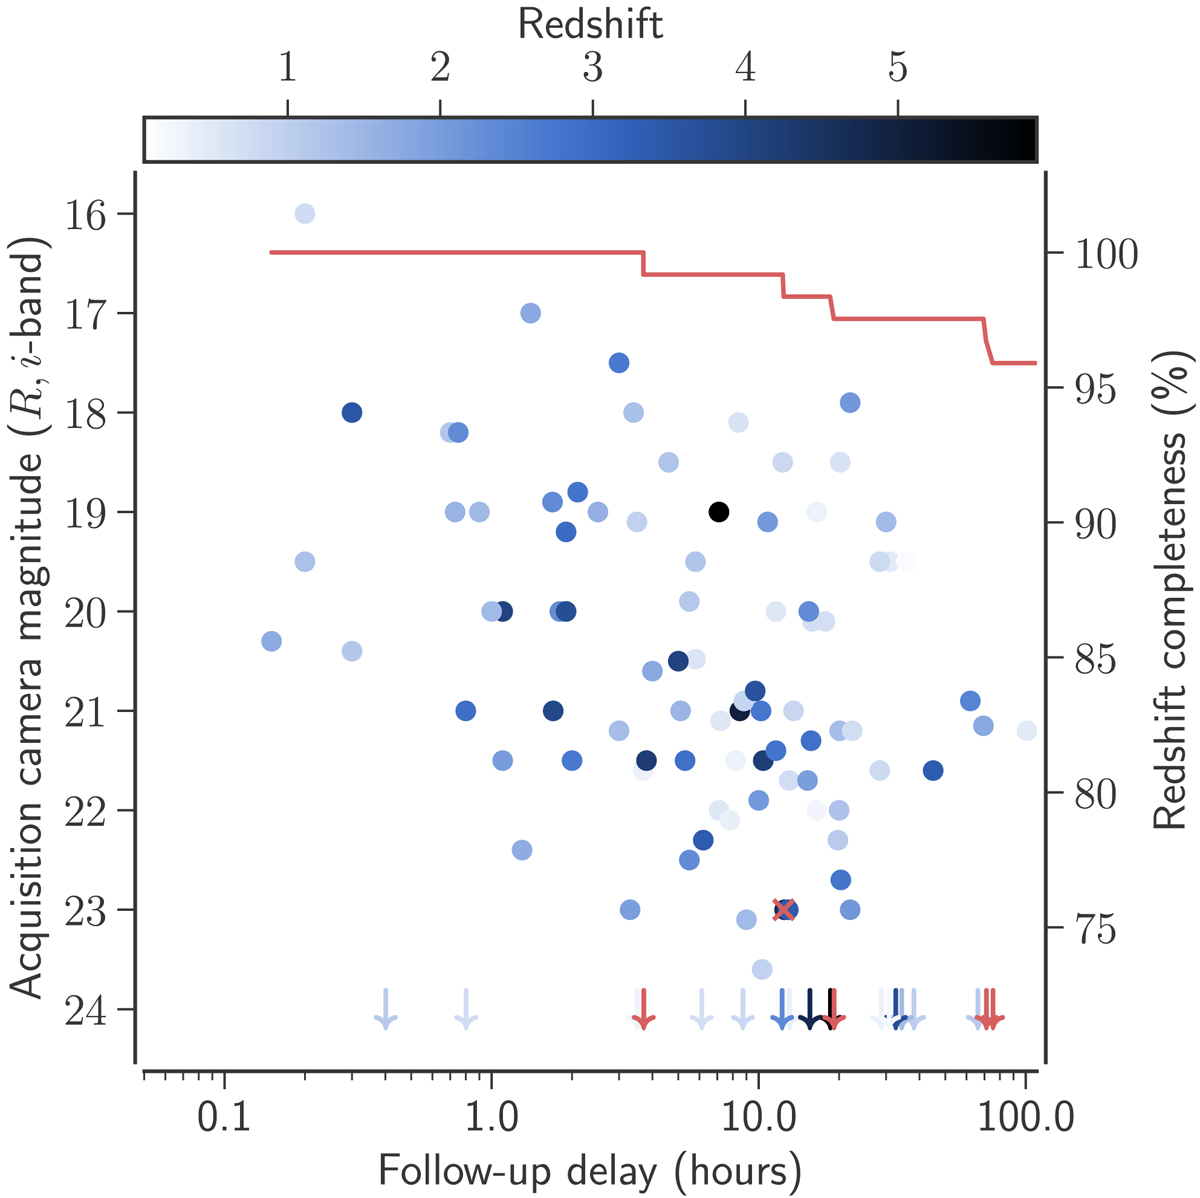
Afterglow magnitude at the start of observation and redshift completeness as a function of follow-up delay for all the afterglows that have been followed up. The points have been coloured based on the redshift of the corresponding burst. Red symbols indicate GRBs without a measured redshift and arrows indicate bursts for which the afterglow was not detected in the acquisition image. In red is shown the redshift completeness as a function of follow-up delay.
Current usage metrics show cumulative count of Article Views (full-text article views including HTML views, PDF and ePub downloads, according to the available data) and Abstracts Views on Vision4Press platform.
Data correspond to usage on the plateform after 2015. The current usage metrics is available 48-96 hours after online publication and is updated daily on week days.
Initial download of the metrics may take a while.