Fig. 4.
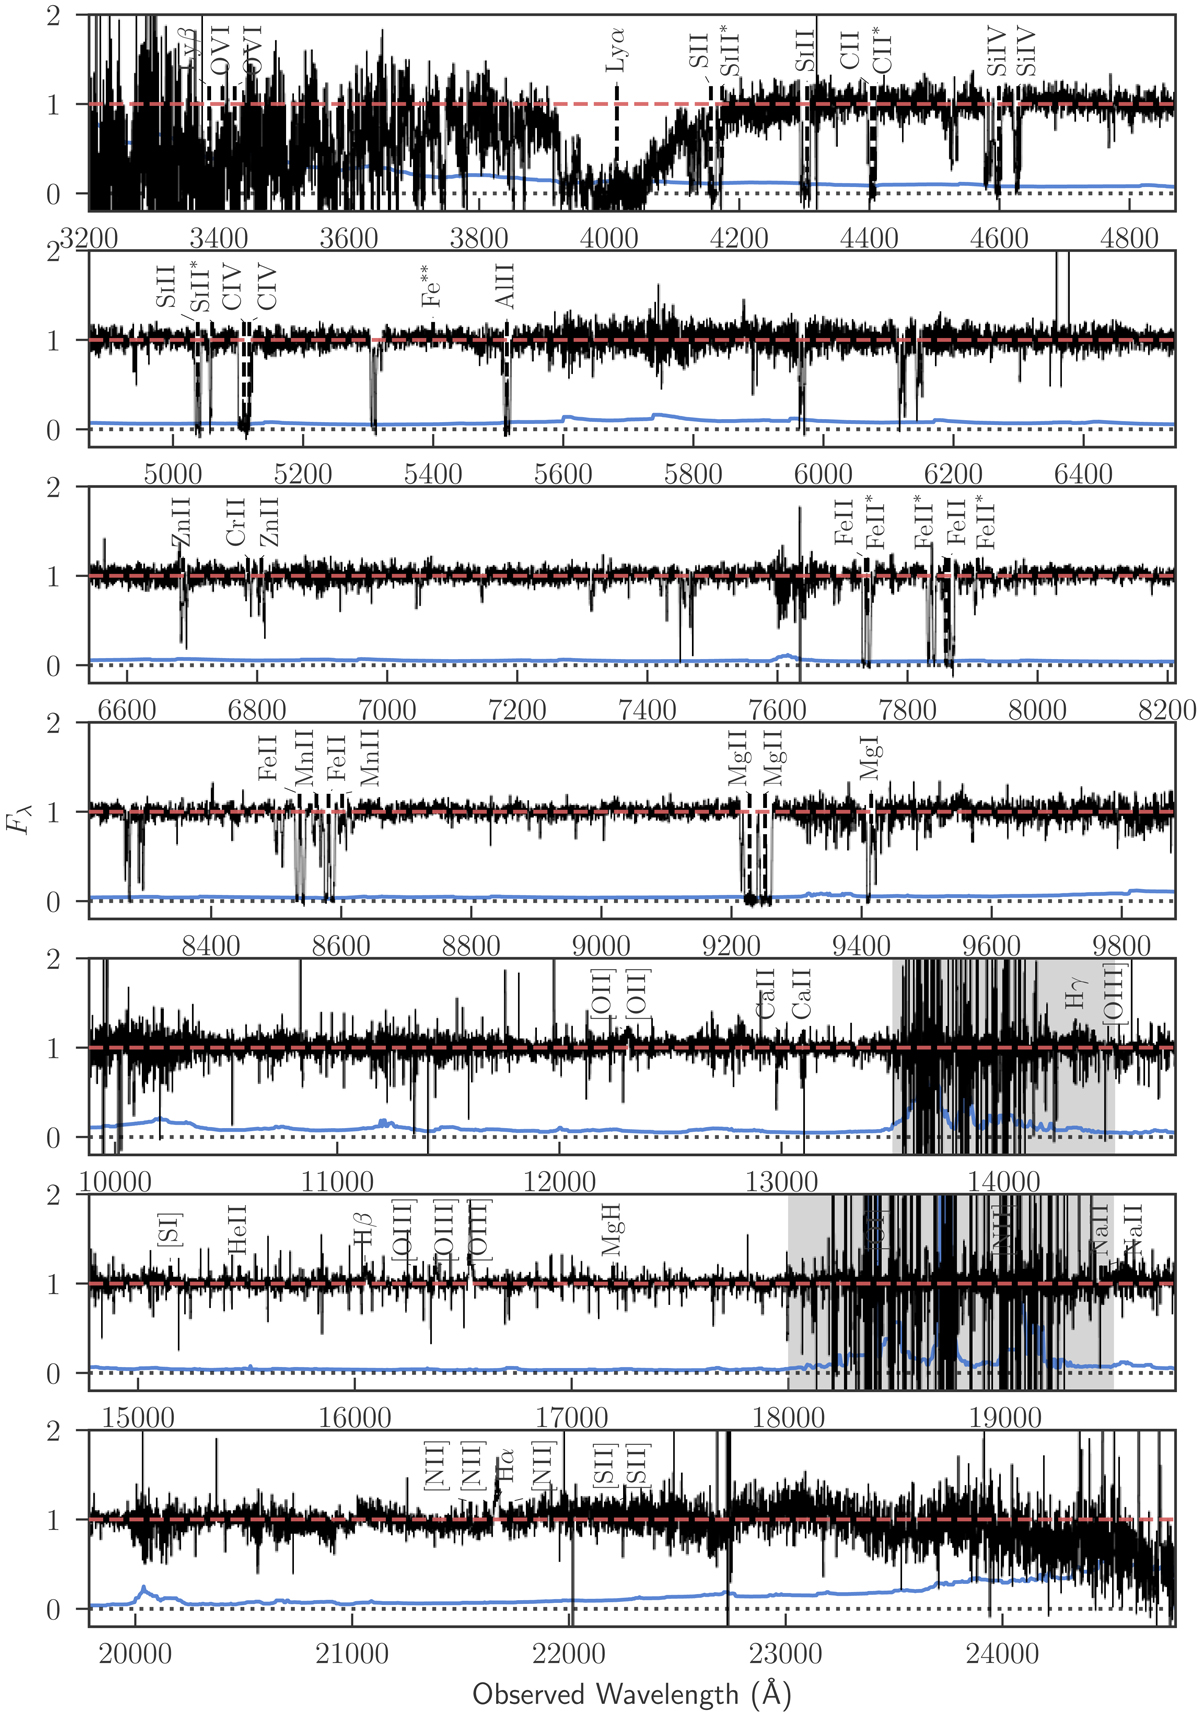
Telluric corrected, normalised spectrum of GRB 121024A at z = 2.300 that illustrates the typical data quality. The continuum estimate is shown in dashed red and the error spectrum in solid blue. The acquisition magnitude is R = 20, meaning it is in the brighter end of the sample presented here, but not the brightest. The spectrum is rich in absorption and emission lines, including absorption from molecular H2. The absorption trough visible at ∼4000 Åis due to Lyα in the host. We have marked the most prominent lines seen in GRB afterglows from Christensen et al. (2011). The regions of most severe telluric absorption are highlighted by grey-shading the background. Additionally, three intervening systems are seen in this sightline. This spectrum has been analysed in detail in Friis et al. (2015).
Current usage metrics show cumulative count of Article Views (full-text article views including HTML views, PDF and ePub downloads, according to the available data) and Abstracts Views on Vision4Press platform.
Data correspond to usage on the plateform after 2015. The current usage metrics is available 48-96 hours after online publication and is updated daily on week days.
Initial download of the metrics may take a while.