Fig. 3.
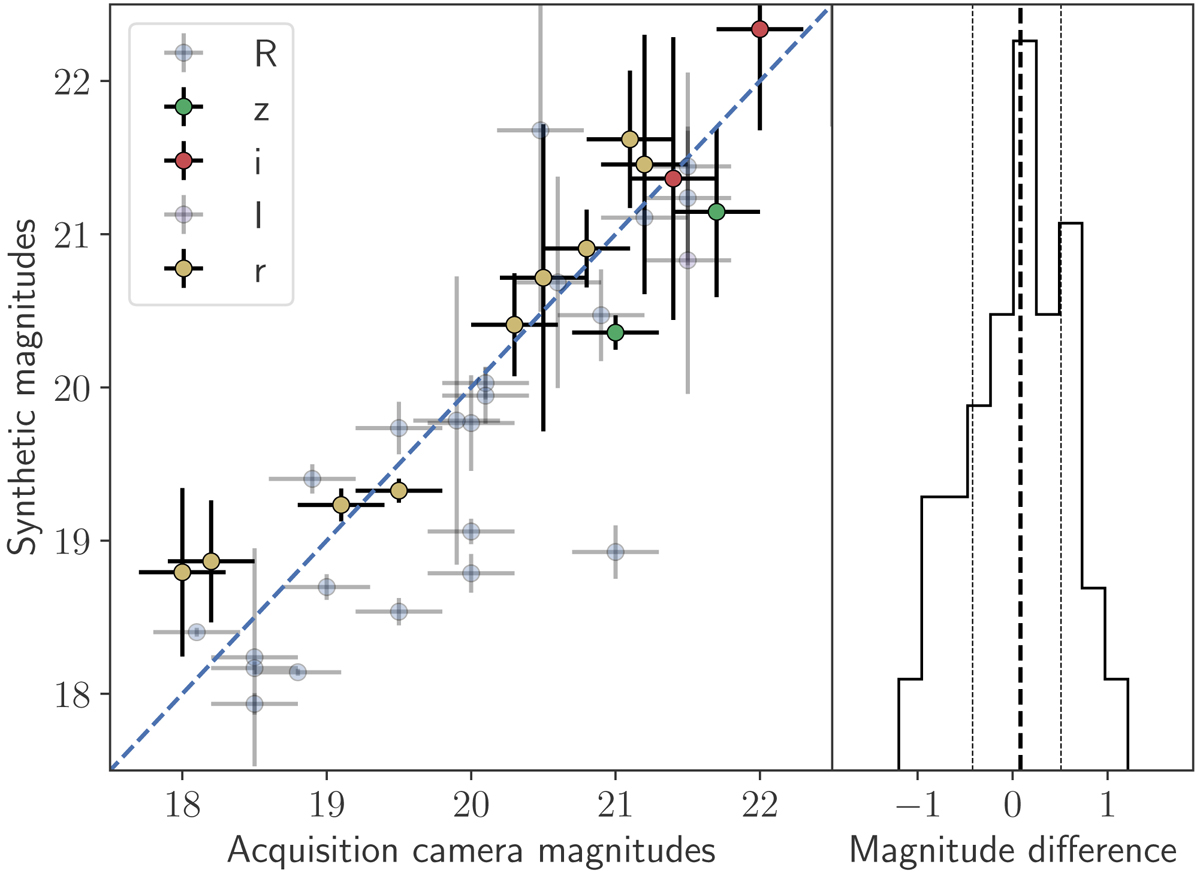
Left panel: acquisition camera magnitudes as a function of synthetic photometry derived from the spectra. The blue, dashed line represent equality between the two measures. The colouring of the data-points shows the photometric passband used by the acquisition camera, as indicated by the labels. The R- and I-band magnitudes have been calibrated against the USNO-B1 catalogue, which has a poor photometric accuracy; this contributes significantly to the observed scatter, and for this reason we indicate these data with a light colour. Right panel: histogram of the differences between the two. The vertical lines in the histogram indicates the 16th, 50th, and 84th percentiles of the distribution (![]() ). This shows the accuracy of the flux calibration.
). This shows the accuracy of the flux calibration.
Current usage metrics show cumulative count of Article Views (full-text article views including HTML views, PDF and ePub downloads, according to the available data) and Abstracts Views on Vision4Press platform.
Data correspond to usage on the plateform after 2015. The current usage metrics is available 48-96 hours after online publication and is updated daily on week days.
Initial download of the metrics may take a while.