Fig. 10.
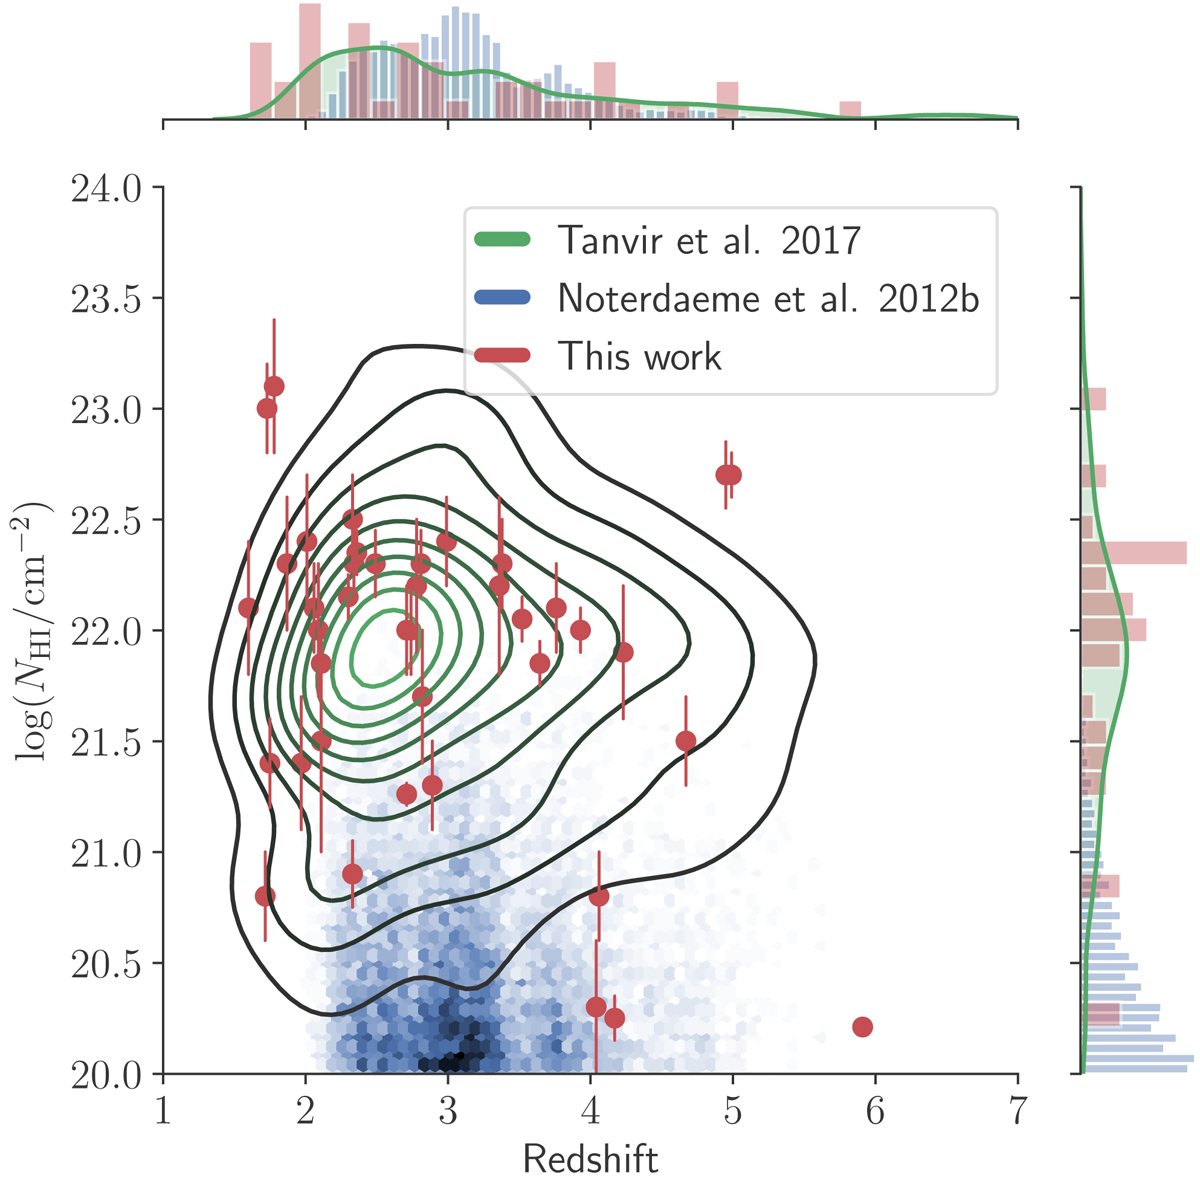
Distributions of hydrogen column densities for absorbers found in quasar absorption lines, from Noterdaeme et al. (2012) in blue. Overplotted in green is the kernel density estimate of absorbers in GRB sightlines. Values are taken from the compilation in Tanvir et al. (2019), along with the new values presented in this sample. We also show in the red the values derived in this work. The marginal distributions for the three samples are also shown along the left side and on the top, where the different environments probed are clearly visible in the hydrogen column densities, as previously also noted in Fynbo et al. (2009). To correct for geometric differences between GRB DLAs and QSO DLAs, we have multiplied the inferred GRB DLA NHI by a factor of two.
Current usage metrics show cumulative count of Article Views (full-text article views including HTML views, PDF and ePub downloads, according to the available data) and Abstracts Views on Vision4Press platform.
Data correspond to usage on the plateform after 2015. The current usage metrics is available 48-96 hours after online publication and is updated daily on week days.
Initial download of the metrics may take a while.