Fig. 1.
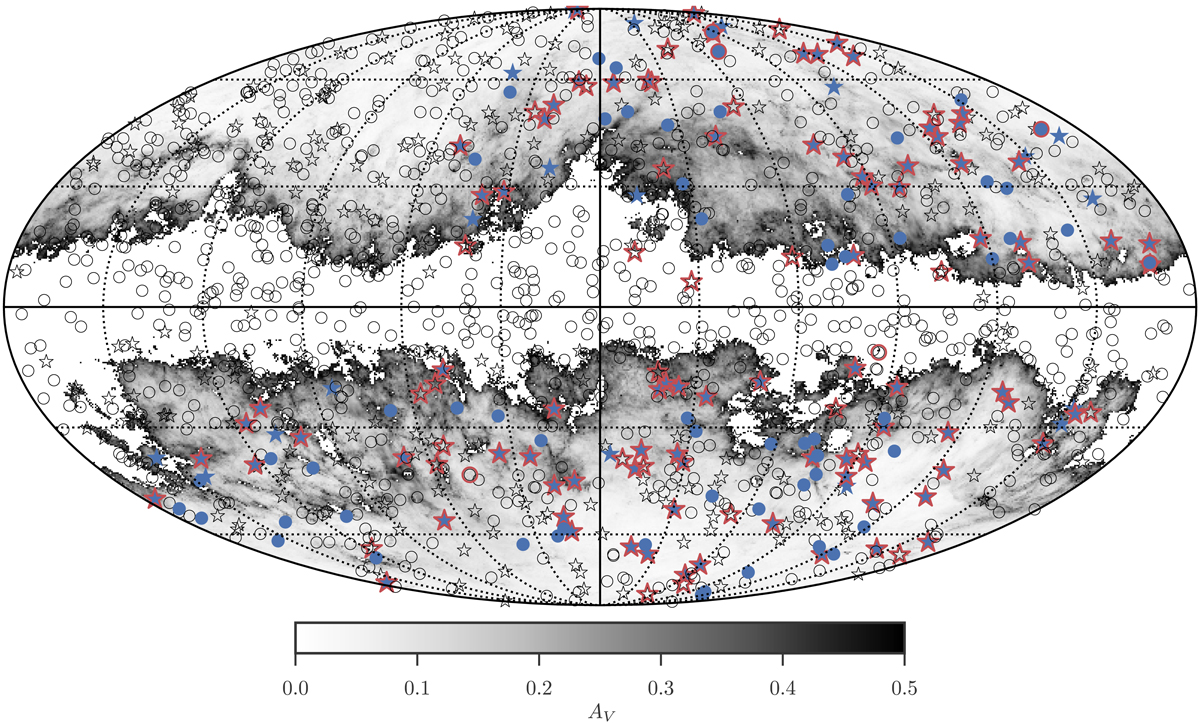
Mollweide projection in Galactic coordinates of the full sky showing the positions on the sky of the bursts presented in this work. The equator is the Galactic plane. The empty stars/circles are the positions of all the 1266 Swift bursts detected until 31/03/2017. Stars indicate bursts with measured redshifts and circles indicate those without. Blue stars indicate the position of the 104 bursts fulfilling the sample criteria specified in Sect. 2.1 that have a measured redshift. Red outlines are added to the 84 GRBs that enter our statistical sample with both X-shooter spectroscopy and a measured redshift. Red outlines of empty stars represent bursts which have been observed with X-shooter and has a measured redshift, but is not a part of our statistical sample. The blue dots show the positions of the 61 GRBs of our statistical sample that lack redshift measurements. A red outline is added around the six bursts in our statistical sample which were observed with X-shooter, but did not yield a redshift measurement. Two empty circles with red outlines indicate bursts outside the statistical sample that were followed up with X-shooter, but without a redshift measurement. The different samples are compared in Sect. 4. The background shows the dust maps presented in Schlegel et al. (1998). We note that we removed the background where the sample criterion is violated (AV > 0.5 mag) and replaced it with a white background. The grey scale bar below indicates the value of AV on the plot. The dotted lines indicate intervals of 30° in longitude and latitude.
Current usage metrics show cumulative count of Article Views (full-text article views including HTML views, PDF and ePub downloads, according to the available data) and Abstracts Views on Vision4Press platform.
Data correspond to usage on the plateform after 2015. The current usage metrics is available 48-96 hours after online publication and is updated daily on week days.
Initial download of the metrics may take a while.