Fig. 9.
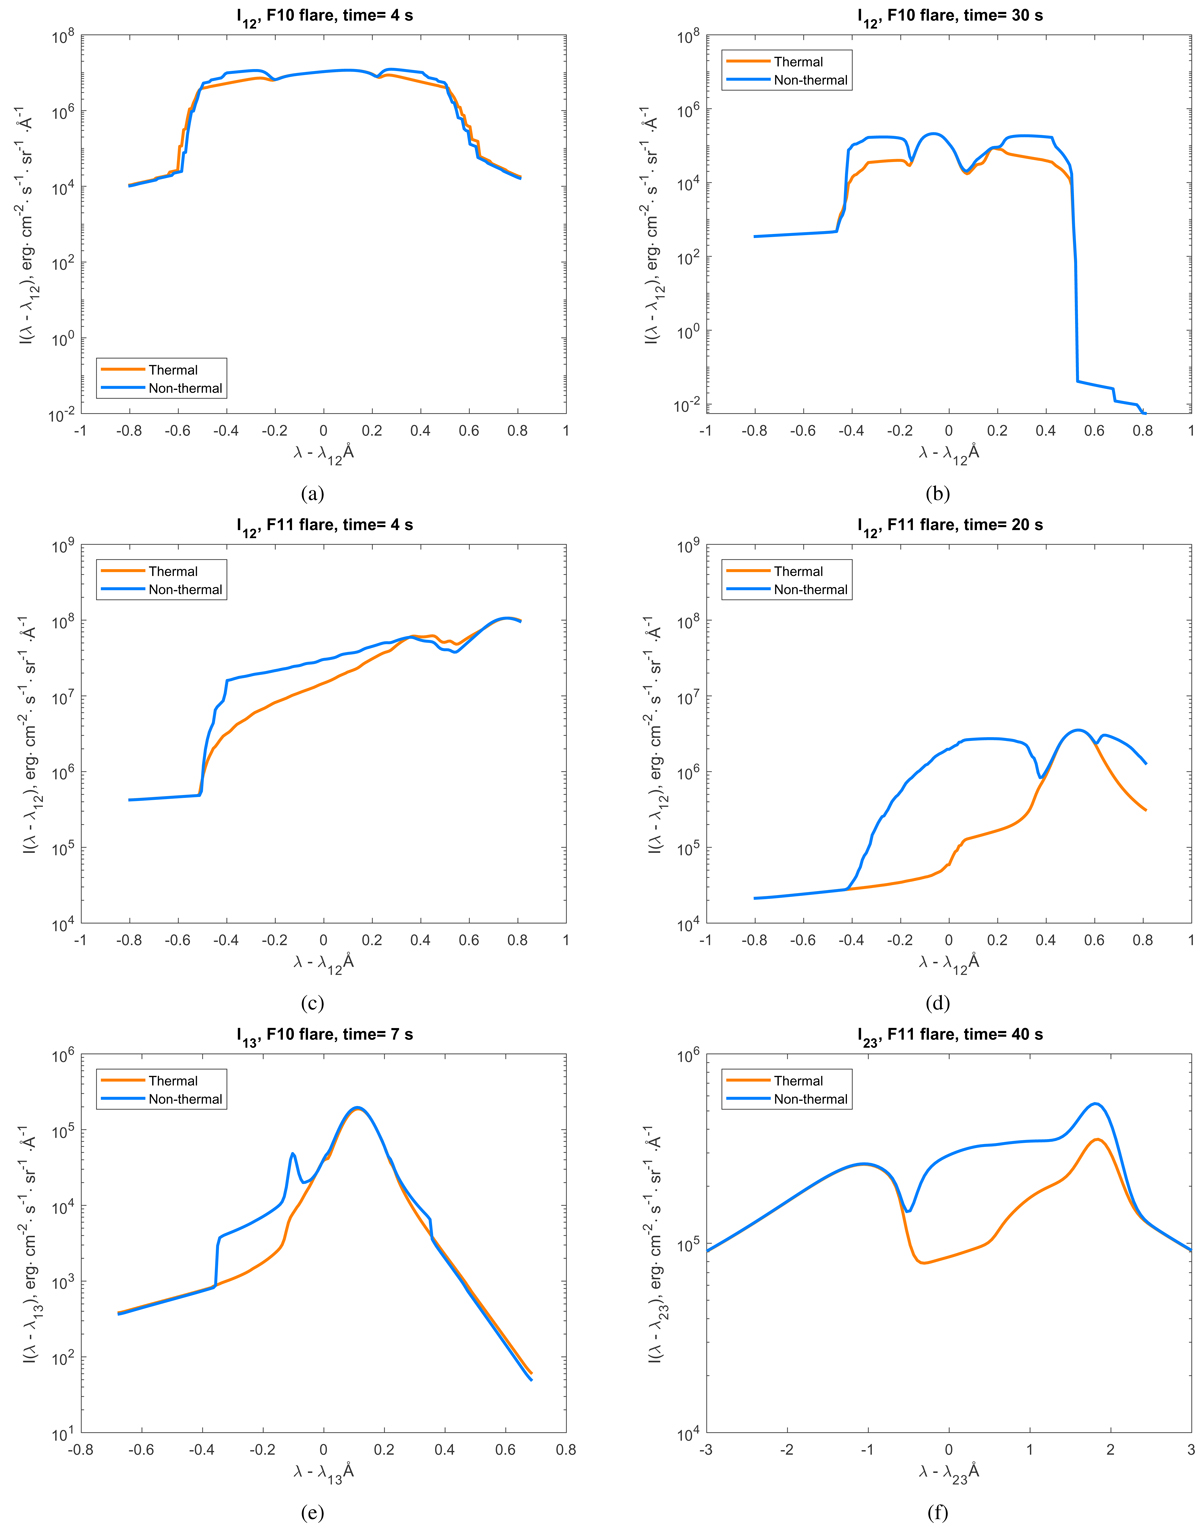
Comparison of the emission in a thermal and a non-thermal flaring atmosphere. Thermal profiles are shown by the red lines, and non-thermal lines are shown in blue. Profiles are shown for the Lyα line after 4 s of the beam onset (panel a) and at 30 s (panel b) for the F10 flare, and after 4 s (panel c) 20 s (panel d) in the F11 flare model. The Lyβ line profiles are shown at 7 s of the simulation for the F10 flare (panel e). The Hα line profiles are shown at 40 s in the simulation for the F11 flare (panel f).
Current usage metrics show cumulative count of Article Views (full-text article views including HTML views, PDF and ePub downloads, according to the available data) and Abstracts Views on Vision4Press platform.
Data correspond to usage on the plateform after 2015. The current usage metrics is available 48-96 hours after online publication and is updated daily on week days.
Initial download of the metrics may take a while.