Free Access
Fig. 7.
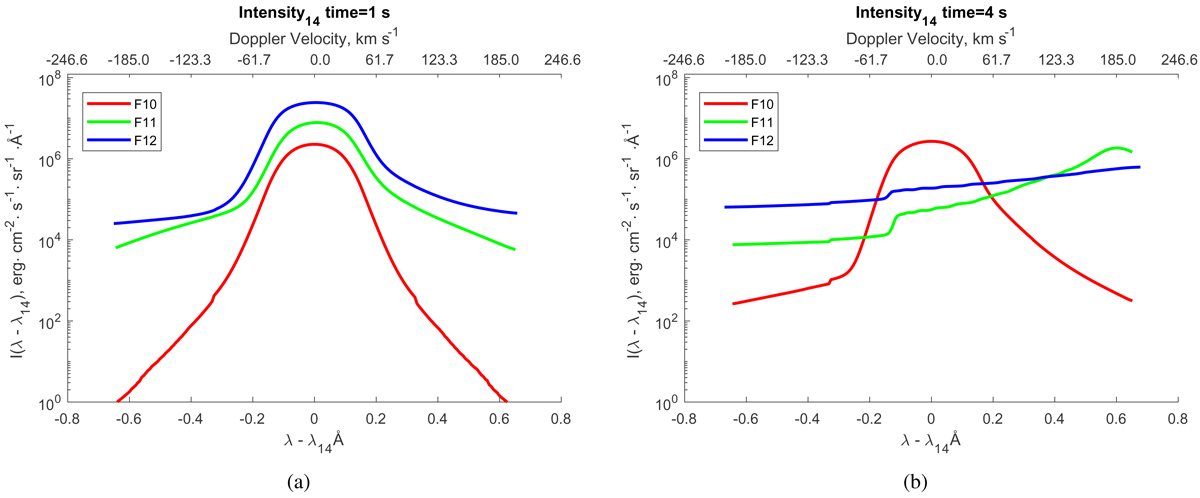
Lyγ line profiles during the impulsive phase. The profiles for the F10 model are shown with a red line, the F11 with a green line, and the F12 with blue for 1 s after beam injection begins in panel a and after 4 s in panel b. These profiles are found to be similar to the Lyβ line profiles at the same times.
Current usage metrics show cumulative count of Article Views (full-text article views including HTML views, PDF and ePub downloads, according to the available data) and Abstracts Views on Vision4Press platform.
Data correspond to usage on the plateform after 2015. The current usage metrics is available 48-96 hours after online publication and is updated daily on week days.
Initial download of the metrics may take a while.