Fig. 11.
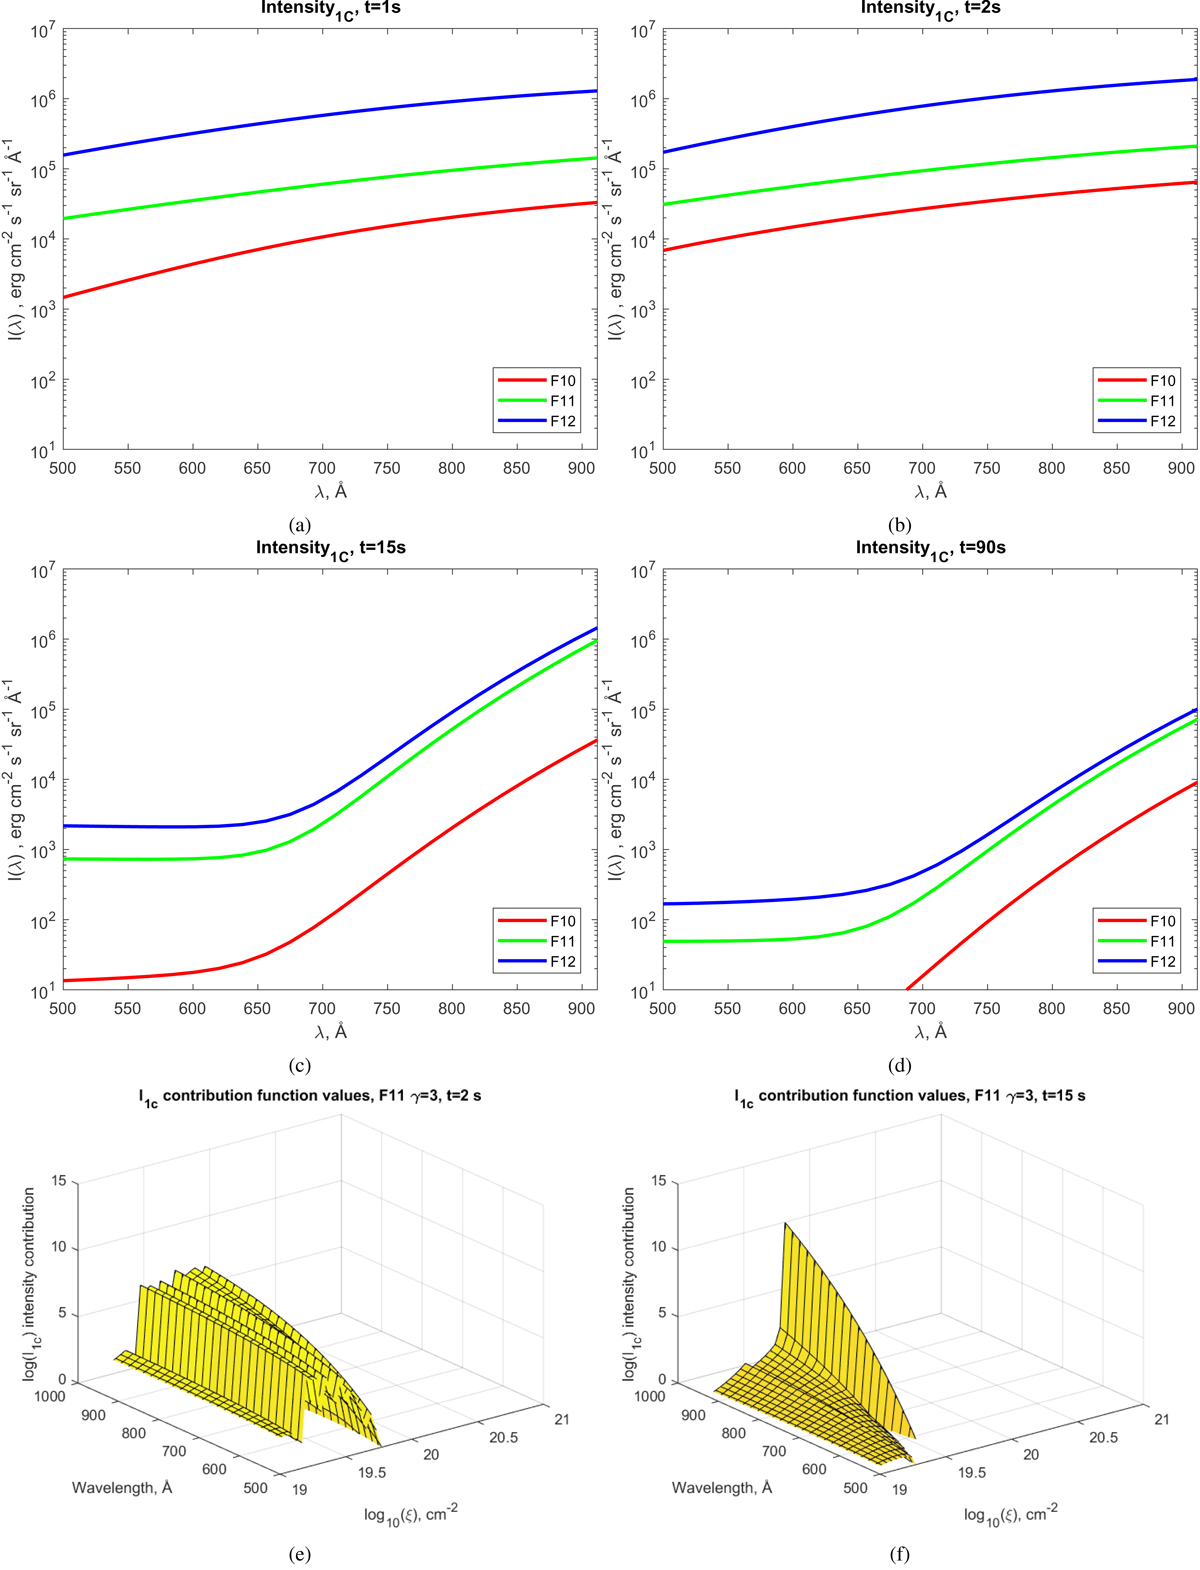
Lyman continuum emission. Profiles are shown during the impulsive phase at 1 s (panel a) and 2 s (panel b) after the beam onset, and during the gradual phase after 15 s (panel c) and 90 s (panel d), calculated for the F10 (red line), F11 (green line), and F12 (blue line) models. Panels e and f: zoomed-in view of the logarithm of the Lyman continuum contribution functions for the F11 model after 2 and 15 s of the simulation, respectively. The contribution functions are plotted as functions of wavelength and column depth, demonstrating the column depths and, thus, the conditions responsible for the difference in gradient of the continuum emission during and after the beam injection phase of the flare.
Current usage metrics show cumulative count of Article Views (full-text article views including HTML views, PDF and ePub downloads, according to the available data) and Abstracts Views on Vision4Press platform.
Data correspond to usage on the plateform after 2015. The current usage metrics is available 48-96 hours after online publication and is updated daily on week days.
Initial download of the metrics may take a while.