Fig. 1.
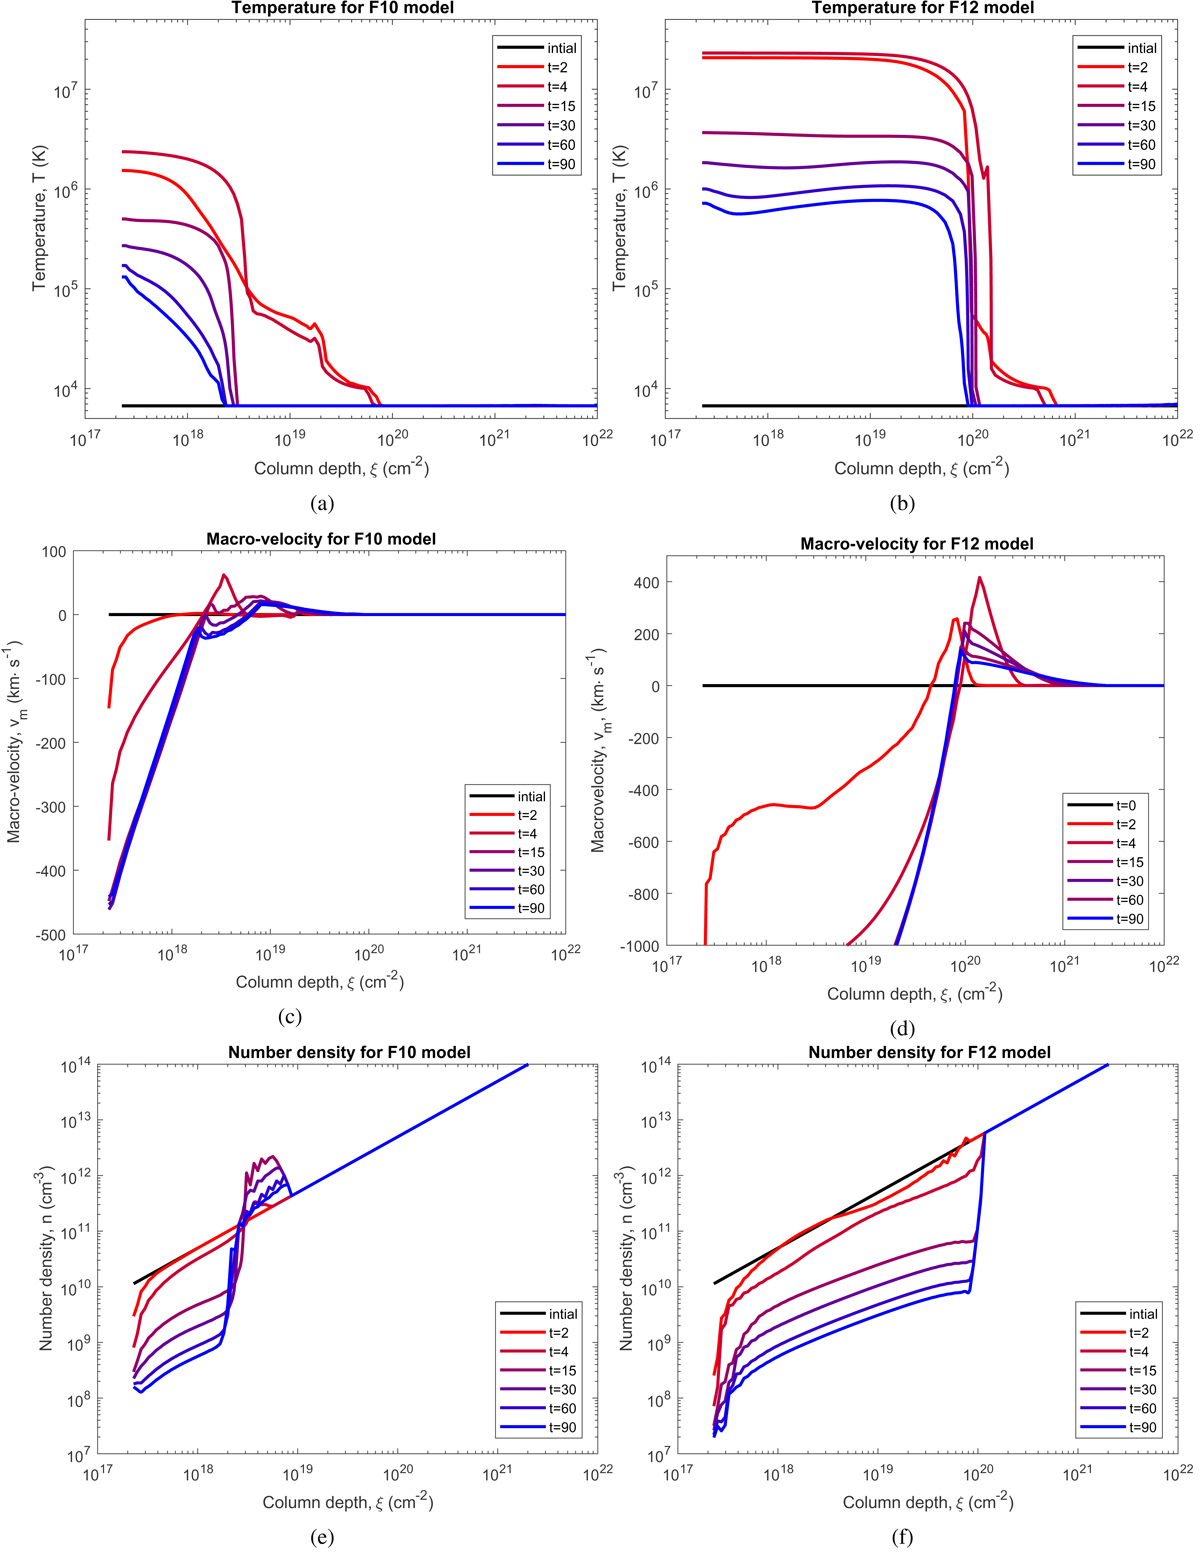
Top row: temperatures (K), middle row: macro-velocities (km s−1), and bottom row: densities (cm−3) vs. column depth (cm−2) for the F10 (left col.) and F12 (right col.) atmospheric models. These profiles are shown for the initial atmosphere (t = 0 s, black line), impulsive phase atmosphere (t = 2, 4 s, red lines), and gradual phase (t = 15, 30, 60, 90 s, purple to blue lines) of the simulation in each figure. In each model the column depths run from 1017 to 1023 cm−2.
Current usage metrics show cumulative count of Article Views (full-text article views including HTML views, PDF and ePub downloads, according to the available data) and Abstracts Views on Vision4Press platform.
Data correspond to usage on the plateform after 2015. The current usage metrics is available 48-96 hours after online publication and is updated daily on week days.
Initial download of the metrics may take a while.