Fig. 6.
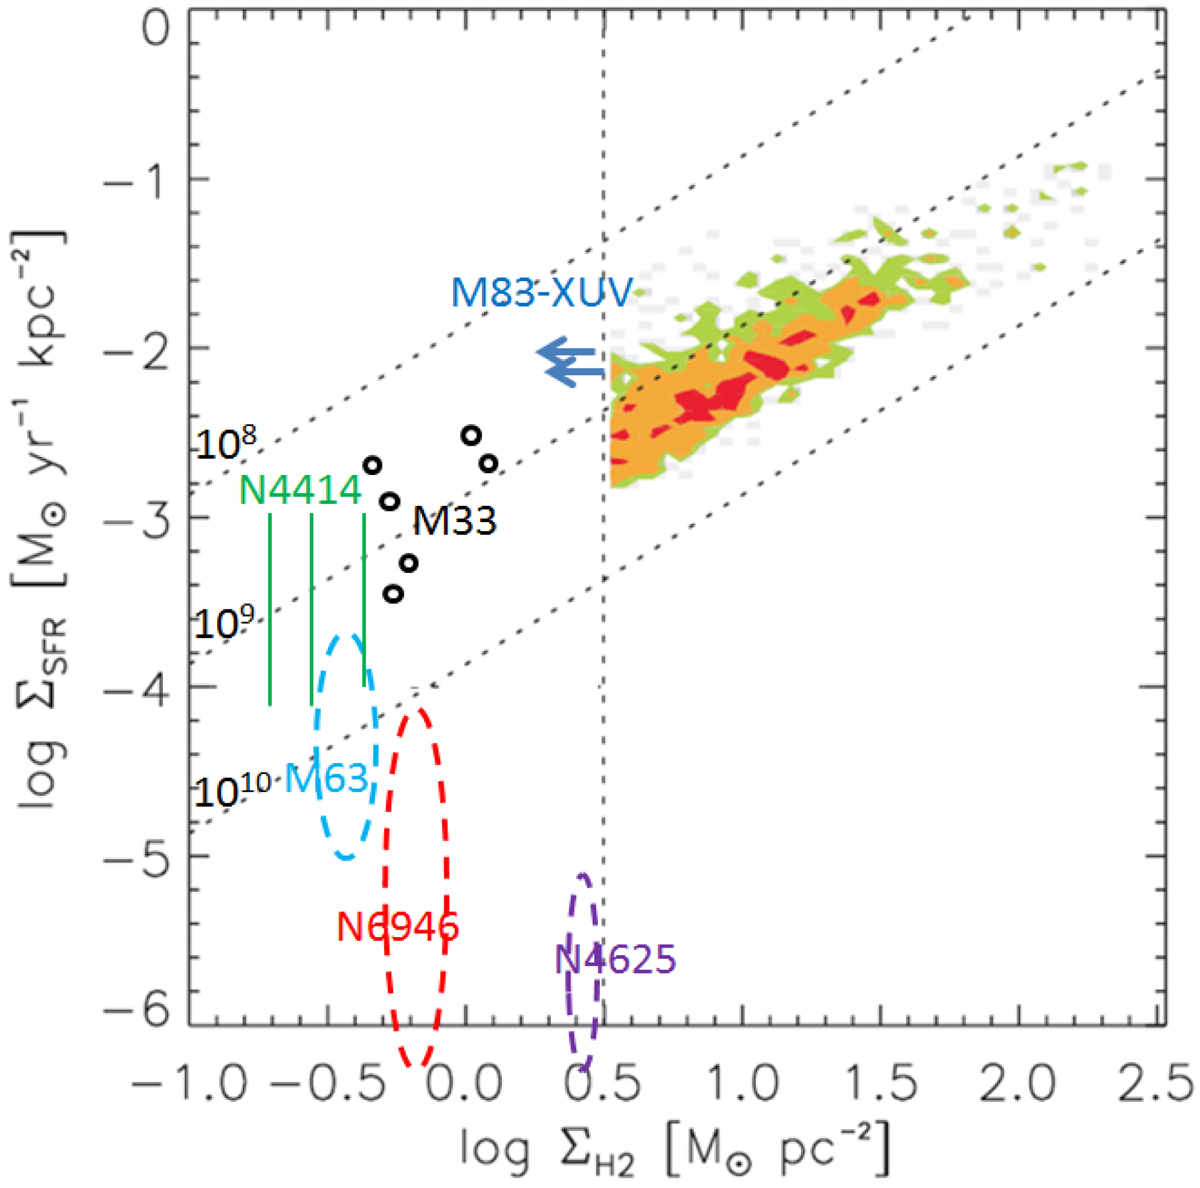
Kennicutt–Schmidt diagram relating the SFR surface density to the molecular gas surface density, adapted from Verdugo et al. (2015) and Bigiel et al. (2008). Dashed ovals represent the data from the outer parts of XUV disk galaxies: NGC4625 and NGC6946 from Watson et al. (2016), and M63 (NGC 5055) from Dessauges-Zavadsky et al. (2014), taking only the molecular gas into account in all of them. The three green vertical bars are from NGC 4414 (Braine & Herpin 2004), and the black circles for M33 (Gratier et al. 2010). The dashed vertical line corresponds to 3 M⊙ pc2, the sensitivity limit of the CO data in Bigiel et al. (2008). Dashed inclined lines correspond to depletion times of 108, 109, and 1010 years to consume all the gas at the present SFR. The horizontal upper limits correspond to our CO(2-1) results on the M83 XUV disk of ΣH2, in two of the main SFR regions, 200 pc in size.
Current usage metrics show cumulative count of Article Views (full-text article views including HTML views, PDF and ePub downloads, according to the available data) and Abstracts Views on Vision4Press platform.
Data correspond to usage on the plateform after 2015. The current usage metrics is available 48-96 hours after online publication and is updated daily on week days.
Initial download of the metrics may take a while.