Open Access
Fig. 4.
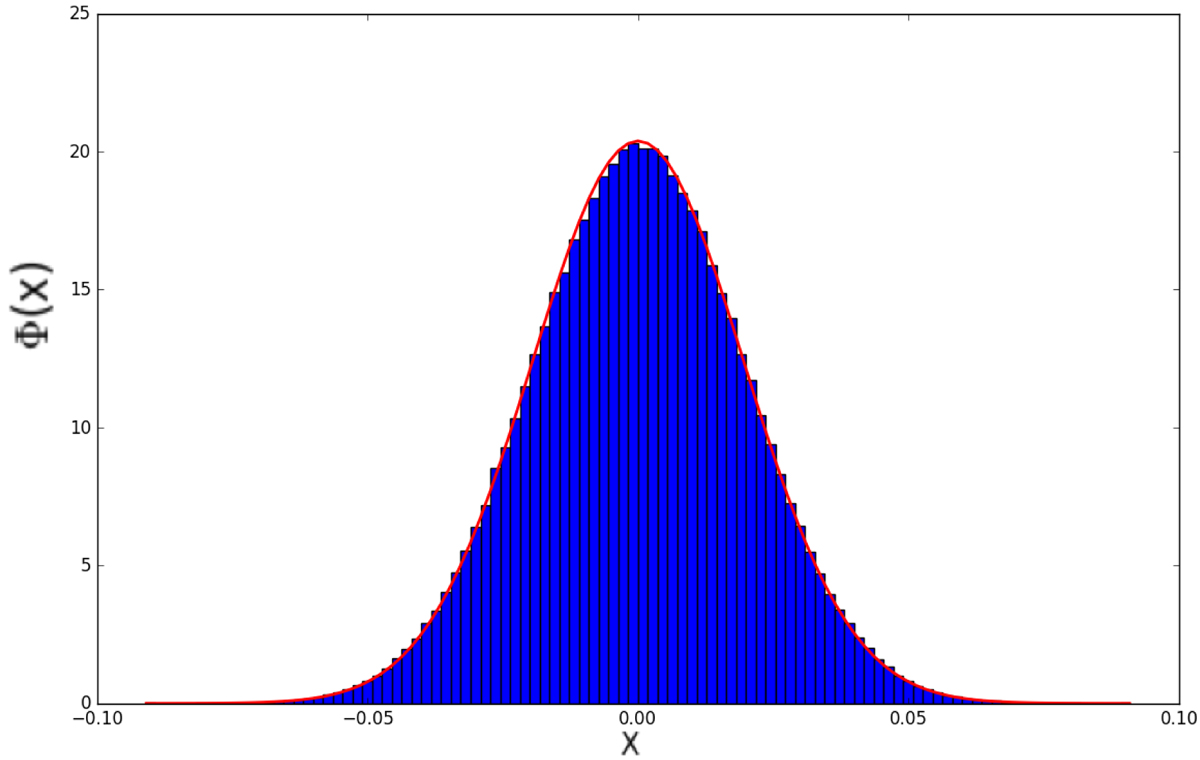
Histogram of the pixel values from the ALMA data cube (our observations). The blue histogram comes from the pixel values and the red curve is a Gaussian fit. We see that the noise is a perfect Gaussian which does not show any indication of bumps that could be related to the reduction and deconvolution procedures.
Current usage metrics show cumulative count of Article Views (full-text article views including HTML views, PDF and ePub downloads, according to the available data) and Abstracts Views on Vision4Press platform.
Data correspond to usage on the plateform after 2015. The current usage metrics is available 48-96 hours after online publication and is updated daily on week days.
Initial download of the metrics may take a while.