Open Access
Fig. 2.
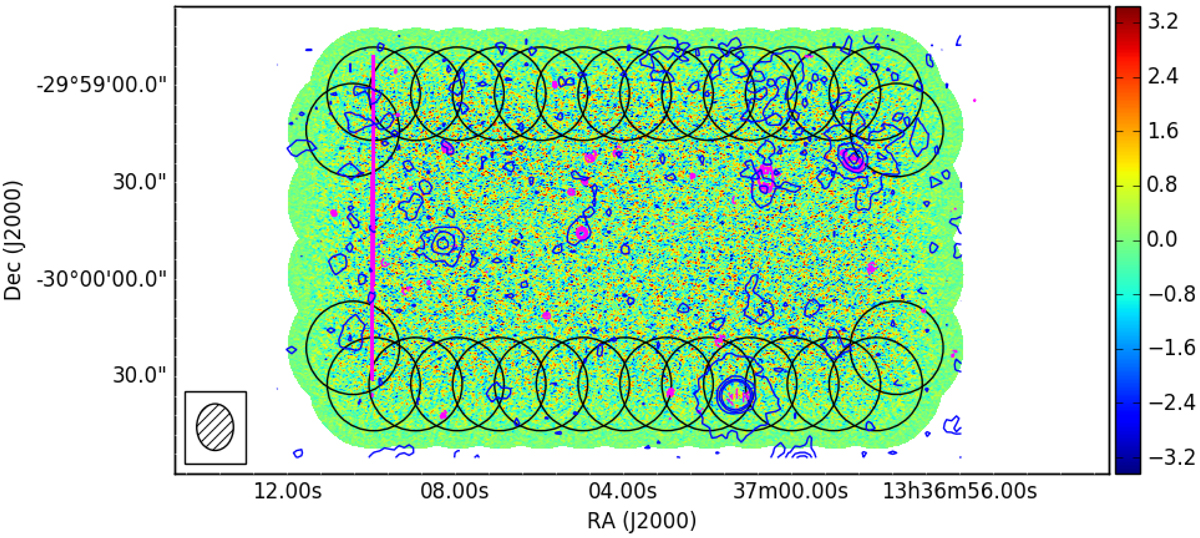
Scheme of the ALMA mosaic of our observations. The black circles of 27″ diameter show the positions of the 121 pointings used to map the CO(2-1) emission. The background image is the CO integrated emission (zero moment of the data cube). The contours are Hα (magenta) and FIR 24 μm (black).
Current usage metrics show cumulative count of Article Views (full-text article views including HTML views, PDF and ePub downloads, according to the available data) and Abstracts Views on Vision4Press platform.
Data correspond to usage on the plateform after 2015. The current usage metrics is available 48-96 hours after online publication and is updated daily on week days.
Initial download of the metrics may take a while.