Fig. 2
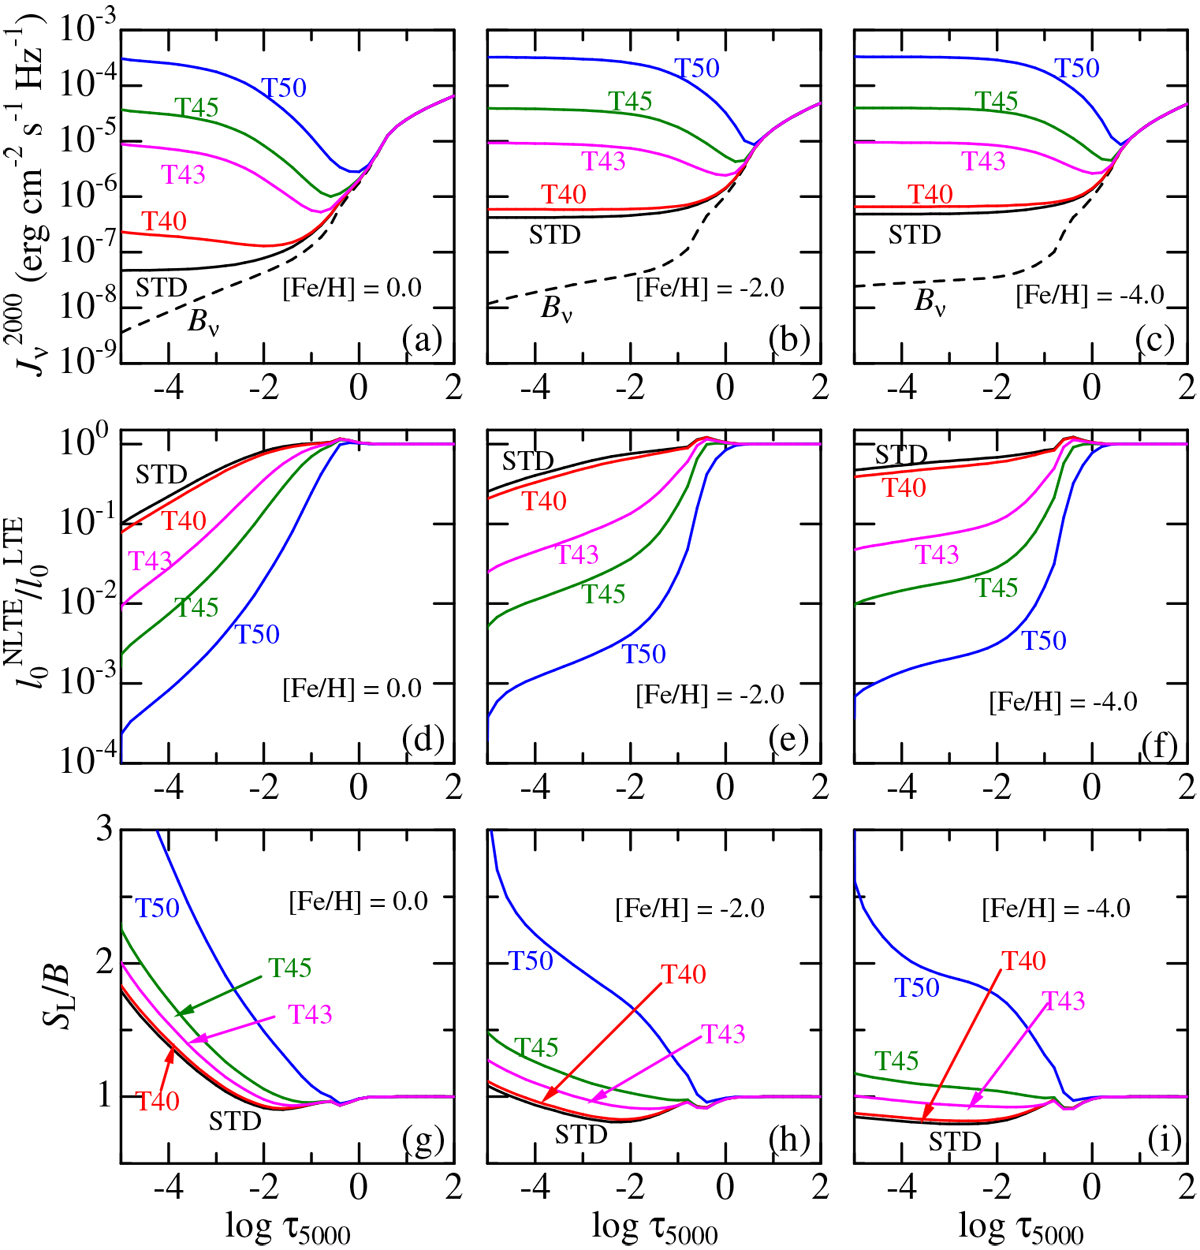
Panels a–c: depth-dependence of ![]() (mean intensity at λ = 2000 Å) for each of the five models (STD, tm30T40, tm30T43, tm30T45, tm30T50); the local Planck function (Bν: dashed line) is also depicted for comparison. Panels d–f and g–i: runs of
(mean intensity at λ = 2000 Å) for each of the five models (STD, tm30T40, tm30T43, tm30T45, tm30T50); the local Planck function (Bν: dashed line) is also depicted for comparison. Panels d–f and g–i: runs of ![]() (ratio of NLTE to LTE line opacity; ≃ b1) and SL ∕B (ratio of line source function to Planck function; ≃ b2∕b1) of the Li I 6708 line, respectively. The abscissa for each panel is the logarithm of continuum optical depth at 5000 Å.
(ratio of NLTE to LTE line opacity; ≃ b1) and SL ∕B (ratio of line source function to Planck function; ≃ b2∕b1) of the Li I 6708 line, respectively. The abscissa for each panel is the logarithm of continuum optical depth at 5000 Å.
Current usage metrics show cumulative count of Article Views (full-text article views including HTML views, PDF and ePub downloads, according to the available data) and Abstracts Views on Vision4Press platform.
Data correspond to usage on the plateform after 2015. The current usage metrics is available 48-96 hours after online publication and is updated daily on week days.
Initial download of the metrics may take a while.