Fig. 9.
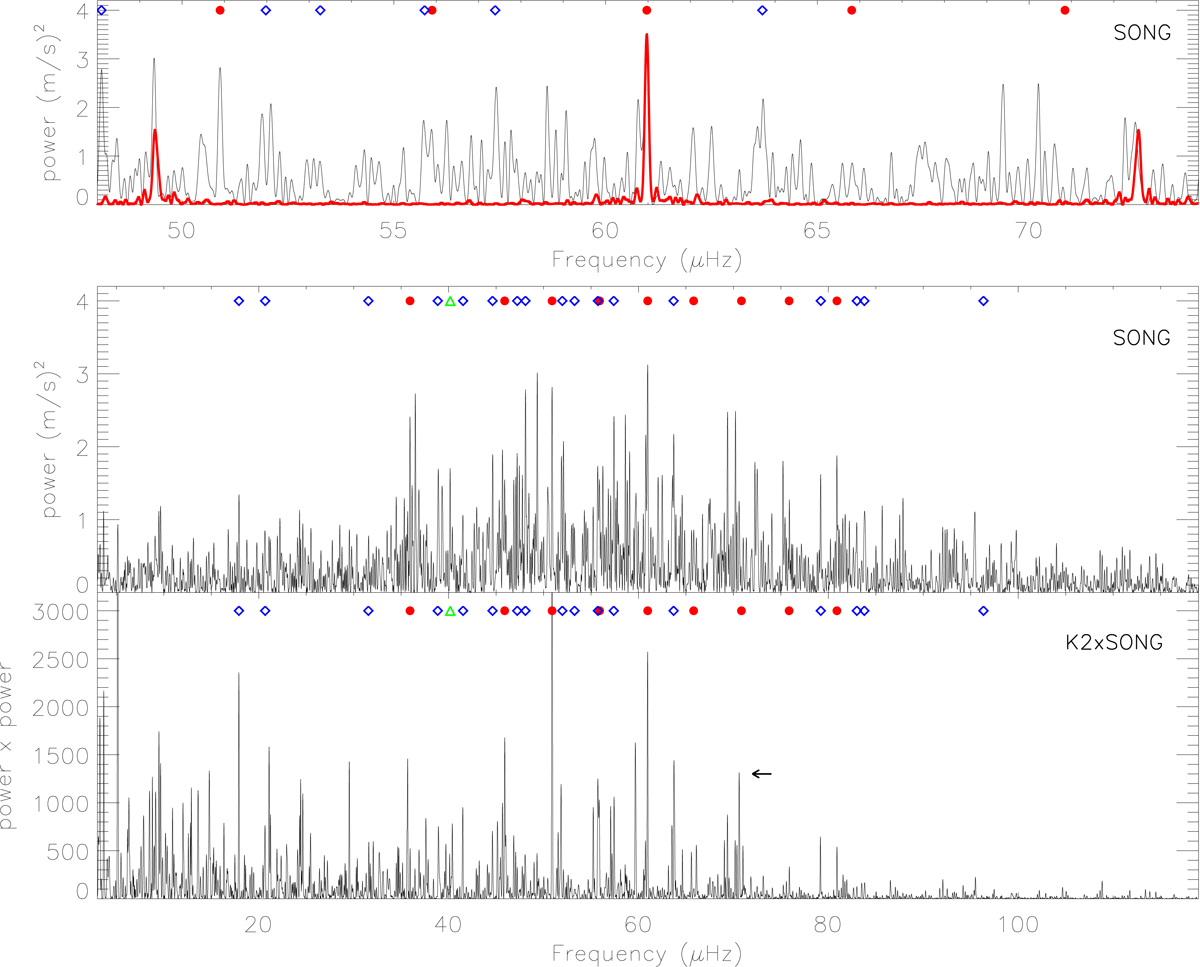
Top panel: close-up of the power spectrum based on the SONG data, centred at the ℓ = 0, n = 11 mode just below 61 μHz. The over-plotted, red curve shows the spectral window for this central ℓ = 0 mode. The detected modes are indicated at the top of the panel, with an identification as in Fig. 8. The ℓ = 0 mode above 70 μHz has a low S/N of only 2.5 in the SONG data, but is more pronounced in the lower panel, where the K2 and SONG spectra are multiplied, as indicated by the arrow. The mode is therefore included in our final frequency list. Relatively strong but undetected peaks are sidelobes of modes outside the frequency range in the close-up view. Two lower panels: full SONG power spectrum and the product of the SONG and K2 power spectra, with the detected modes indicated using the same symbols as in the top panel. The three panels are aligned according to the ℓ = 0 mode just below 61 μHz.
Current usage metrics show cumulative count of Article Views (full-text article views including HTML views, PDF and ePub downloads, according to the available data) and Abstracts Views on Vision4Press platform.
Data correspond to usage on the plateform after 2015. The current usage metrics is available 48-96 hours after online publication and is updated daily on week days.
Initial download of the metrics may take a while.