Fig. 7.
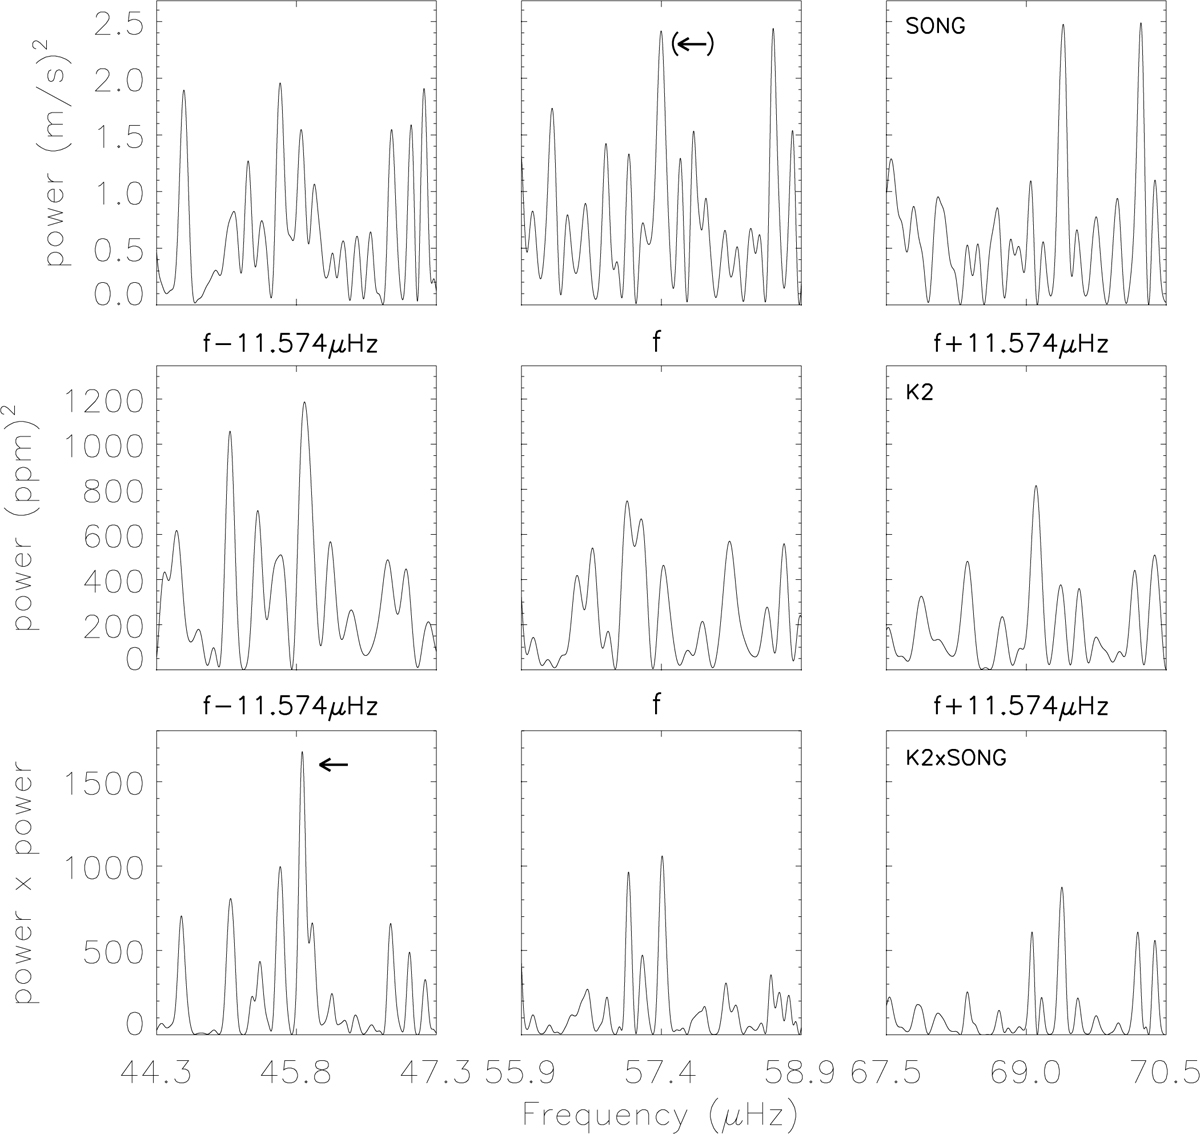
As shown in Fig. 6, one of the modes detected in the original run of CLEAN on the SONG data was likely an 1 d−1 alias of a true ℓ = 0 mode. Three upper panels: SONG data near the originally detected frequency (middle column of panels), and minus (left panel) and plus (right panel) 1 d−1 corresponding to 11.574 μHz. Middle panels: same for the K2 data, and the lower panels for the product of the two. The K2 power spectrum and the product of the SONG and K2 spectra support the interpretation that the originally detected mode was in fact a 1 d−1 alias of the actual mode, which is indicated by an arrow in the lower-left panel.
Current usage metrics show cumulative count of Article Views (full-text article views including HTML views, PDF and ePub downloads, according to the available data) and Abstracts Views on Vision4Press platform.
Data correspond to usage on the plateform after 2015. The current usage metrics is available 48-96 hours after online publication and is updated daily on week days.
Initial download of the metrics may take a while.