Fig. 6.
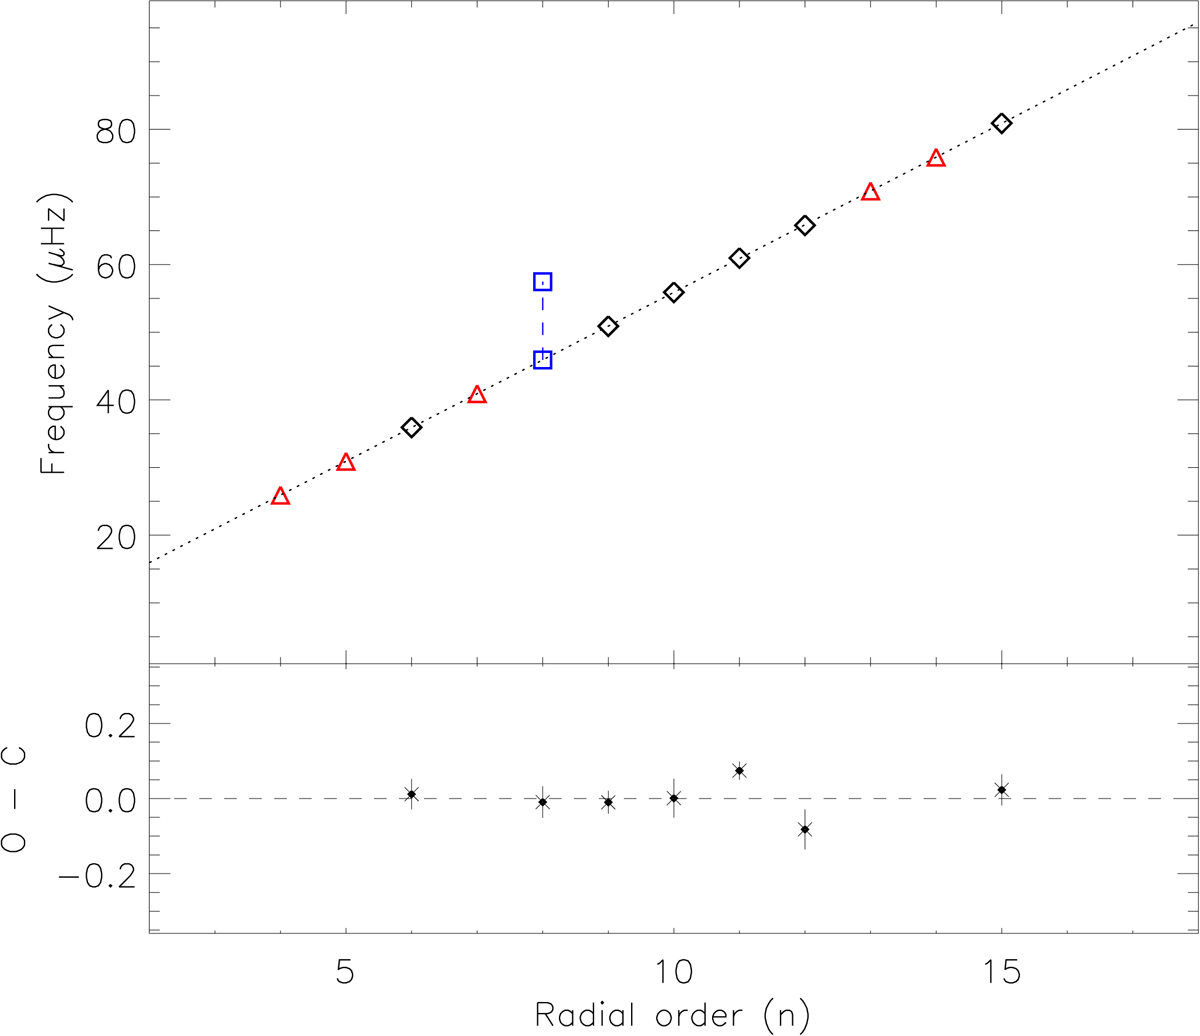
Upper panel: frequencies as a function of radial order (n) for the first stage of our frequency analysis. The dotted line has a slope of 5.00 μHz, in agreement with Δν found in Fig. 5. The black diamonds are detected modes that fit into a regular structure of expected ℓ = 0 modes, red triangles mark the positions of expected ℓ = 0 modes that were undetected in our first run of CLEAN, and the two blue squares represent the detected ℓ = 0, n = 8 mode, for which the first run of CLEAN picked up the +1 d−1 alias (see text). Lower panel: differences between the detected ℓ = 0 frequencies and those predicted by the asymptotic relation (Eq. (1)), also in μHz.
Current usage metrics show cumulative count of Article Views (full-text article views including HTML views, PDF and ePub downloads, according to the available data) and Abstracts Views on Vision4Press platform.
Data correspond to usage on the plateform after 2015. The current usage metrics is available 48-96 hours after online publication and is updated daily on week days.
Initial download of the metrics may take a while.