Fig. 5.
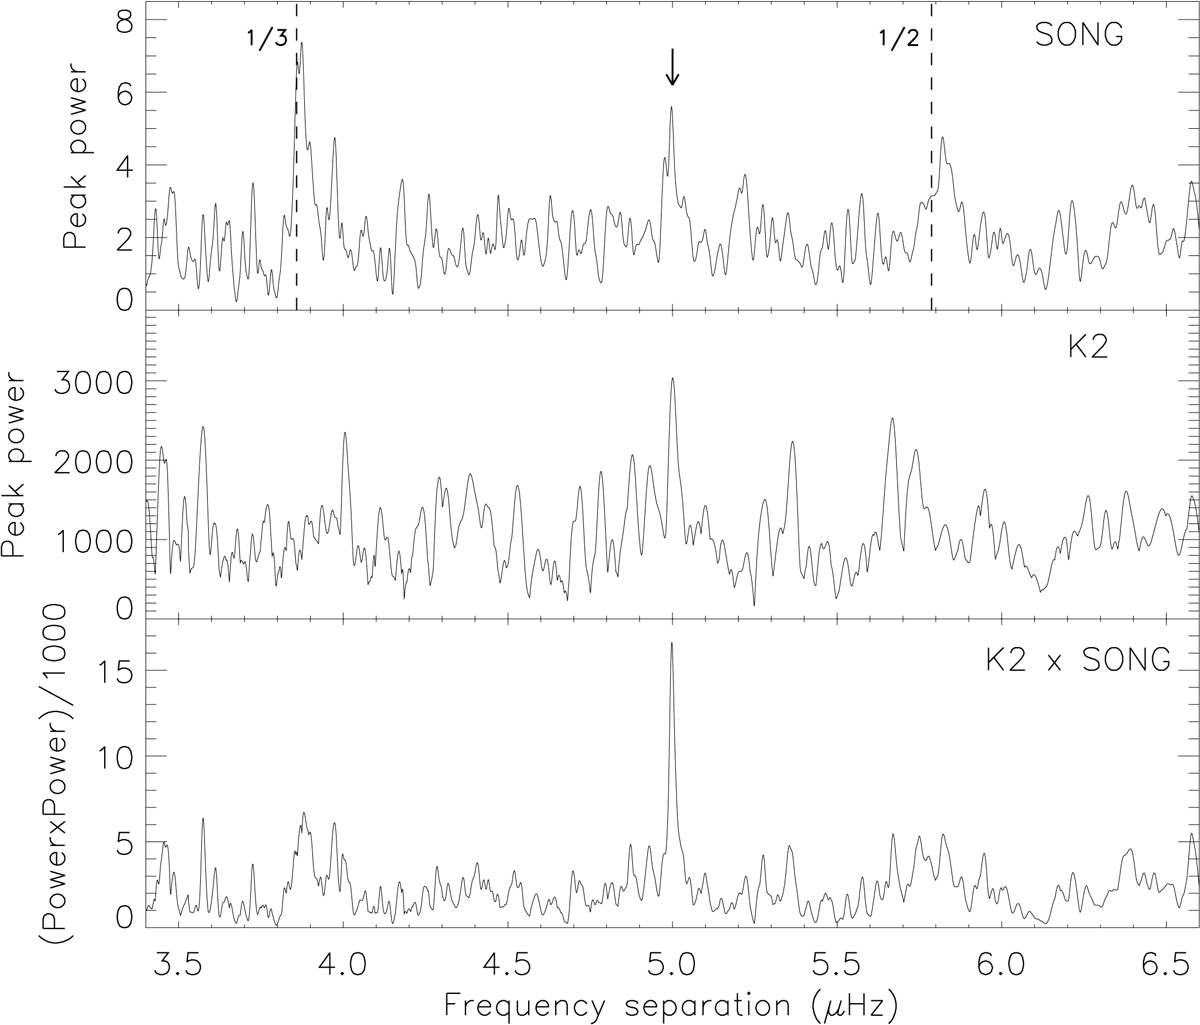
Results of using a modified version of an analysis method developed for solar-like oscillations observed with Kepler, as described in the text. Upper panel: results based on the SONG power spectrum. Middle panel: results for K2. As in Fig 4, the dashed lines in the upper panel indicate signals originating from the 1 d−1 aliases in the spectral window, and the arrow indicates the Δν-value of 5.0 μHz. Bottom panel: SONG and K2 results from the two upper panels are multiplied, resulting in a very clear peak near 5.0 μHz.
Current usage metrics show cumulative count of Article Views (full-text article views including HTML views, PDF and ePub downloads, according to the available data) and Abstracts Views on Vision4Press platform.
Data correspond to usage on the plateform after 2015. The current usage metrics is available 48-96 hours after online publication and is updated daily on week days.
Initial download of the metrics may take a while.