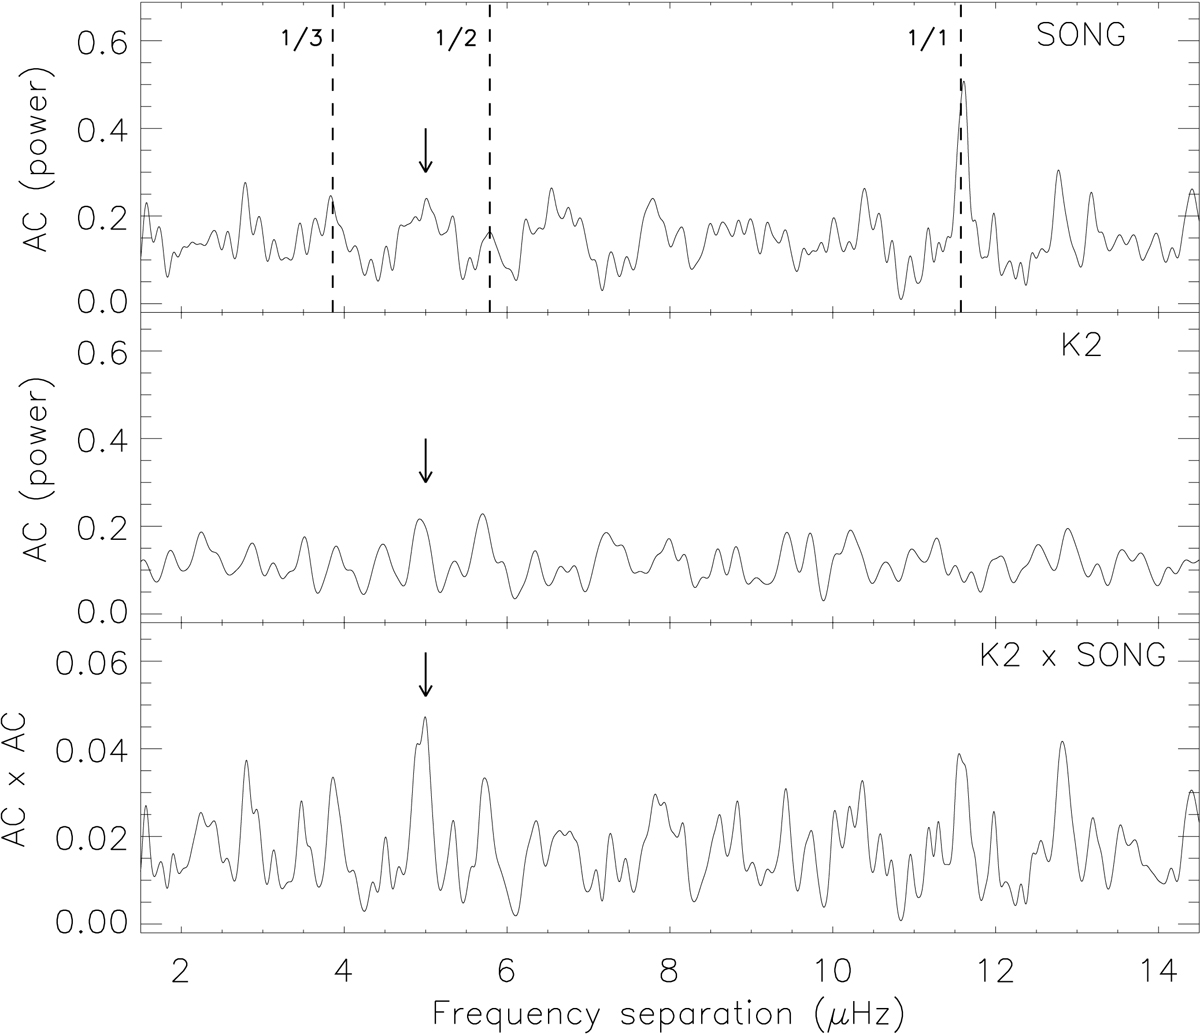
Fig. 4.

Autocorrelations of the power spectra, for the SONG spectrum in the upper panel, and K2 in the middle panel. Bottom panel: the two autocorrelations multiplied together. The vertical dashed lines in the upper panel indicate the signals originating from the 1 d−1 aliases in the spectral window, at 11.574 μHz and integer fractions thereof. The arrows indicate a value of 5.0 μHz, which we identify as Δν for ϵ Tau using various methods (see text).
Current usage metrics show cumulative count of Article Views (full-text article views including HTML views, PDF and ePub downloads, according to the available data) and Abstracts Views on Vision4Press platform.
Data correspond to usage on the plateform after 2015. The current usage metrics is available 48-96 hours after online publication and is updated daily on week days.
Initial download of the metrics may take a while.


