Free Access
Fig. 5.
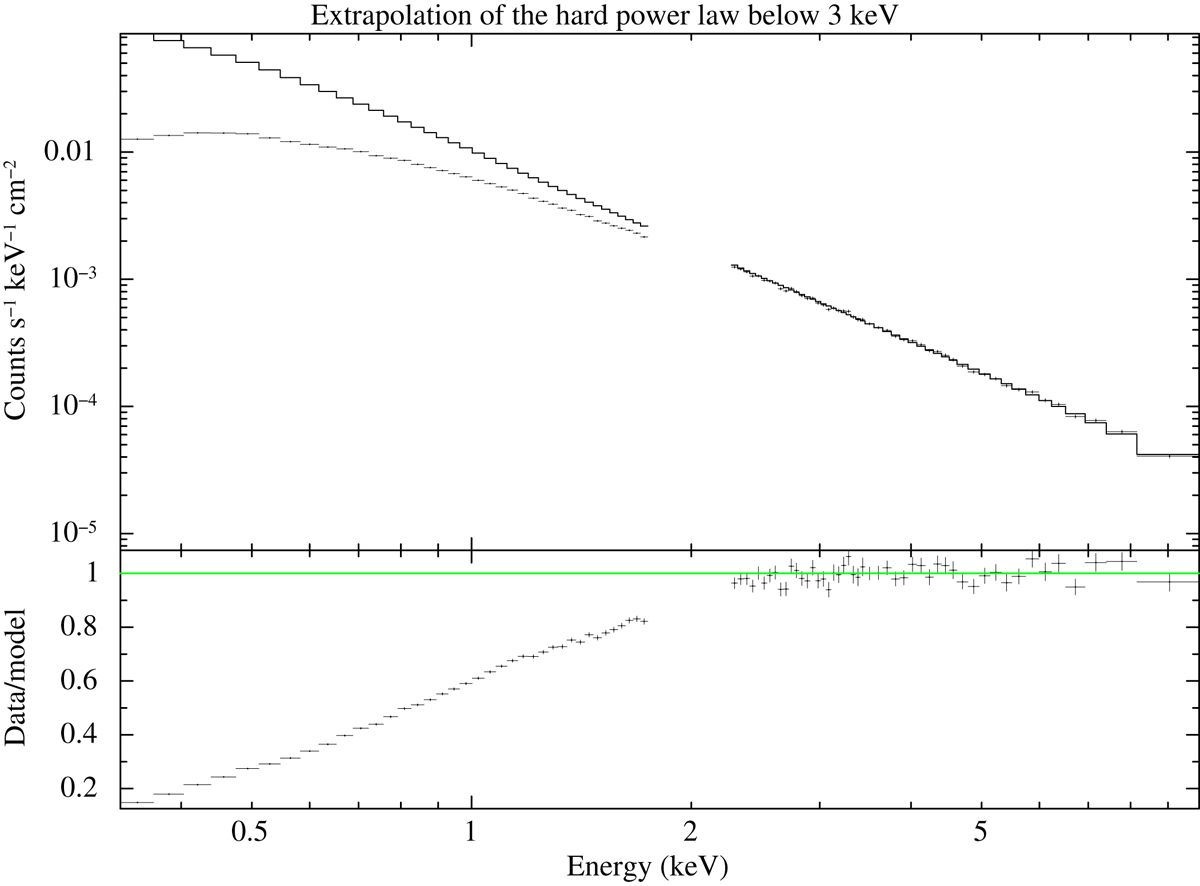
Upper panel: time-averaged XMM-Newton/pn spectrum of Fermi J1544–0639. The power law that best fits the data in the 3–10 keV band is shown as a continuous curve. Lower panel: ratio of the observed spectrum (0.3–10 keV) to best-fit 3–10 keV power law. The data were binned for plotting purposes.
Current usage metrics show cumulative count of Article Views (full-text article views including HTML views, PDF and ePub downloads, according to the available data) and Abstracts Views on Vision4Press platform.
Data correspond to usage on the plateform after 2015. The current usage metrics is available 48-96 hours after online publication and is updated daily on week days.
Initial download of the metrics may take a while.