Free Access
Fig. B.2.
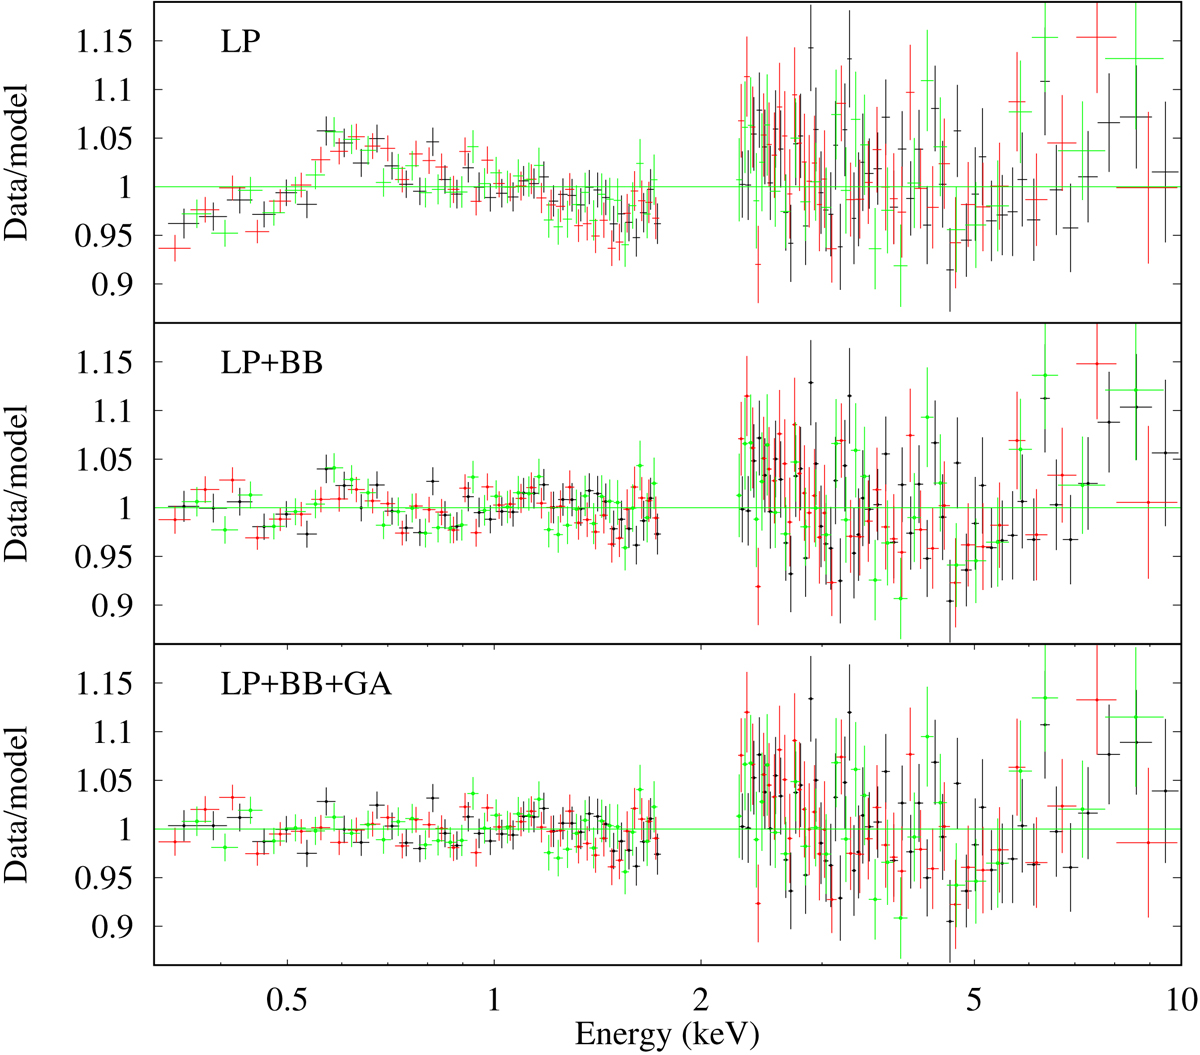
Residuals of the fits of the three pn spectra in the 0.3–10 keV band with the LP model. Upper panel: simple log-parabola. Middle panel: log-parabola plus blackbody. Lower panel: log-parabola plus blackbody and Gaussian line. The data were binned for plotting purposes.
Current usage metrics show cumulative count of Article Views (full-text article views including HTML views, PDF and ePub downloads, according to the available data) and Abstracts Views on Vision4Press platform.
Data correspond to usage on the plateform after 2015. The current usage metrics is available 48-96 hours after online publication and is updated daily on week days.
Initial download of the metrics may take a while.