Fig. 5.
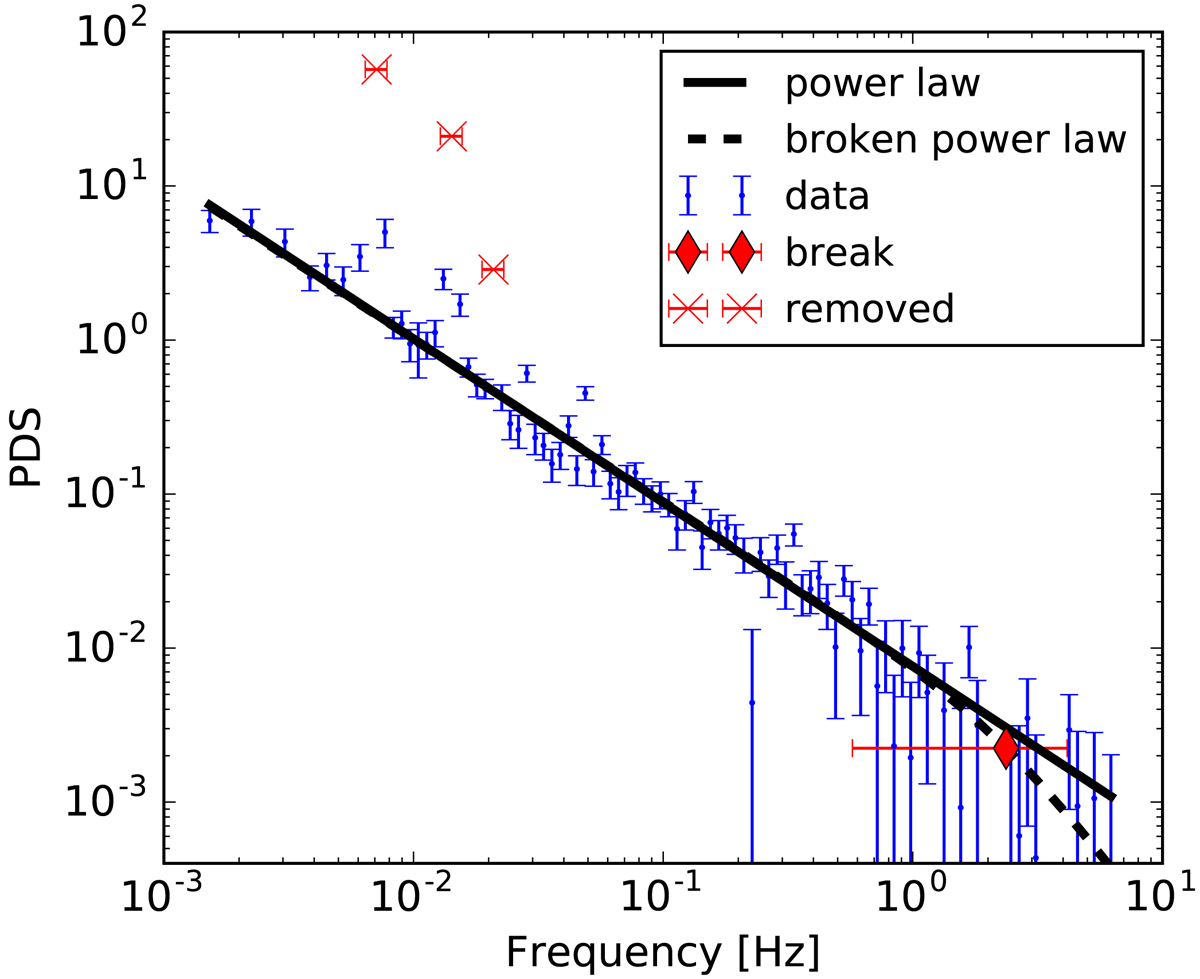
Power density spectrum of Swift J1816.7–1613 obtained from combined light curves from FPMA and FPMB in the 3–79 keV energy band. The solid line represents a single power-law fit with index −1.1. Regular pulsations at ∼7 mHz and their harmonics were masked out in the fit. The dashed line is the broken power-law fit and the red diamond is the resulting break frequency at 2.4 ± 1.8 Hz.
Current usage metrics show cumulative count of Article Views (full-text article views including HTML views, PDF and ePub downloads, according to the available data) and Abstracts Views on Vision4Press platform.
Data correspond to usage on the plateform after 2015. The current usage metrics is available 48-96 hours after online publication and is updated daily on week days.
Initial download of the metrics may take a while.