Fig. 2.
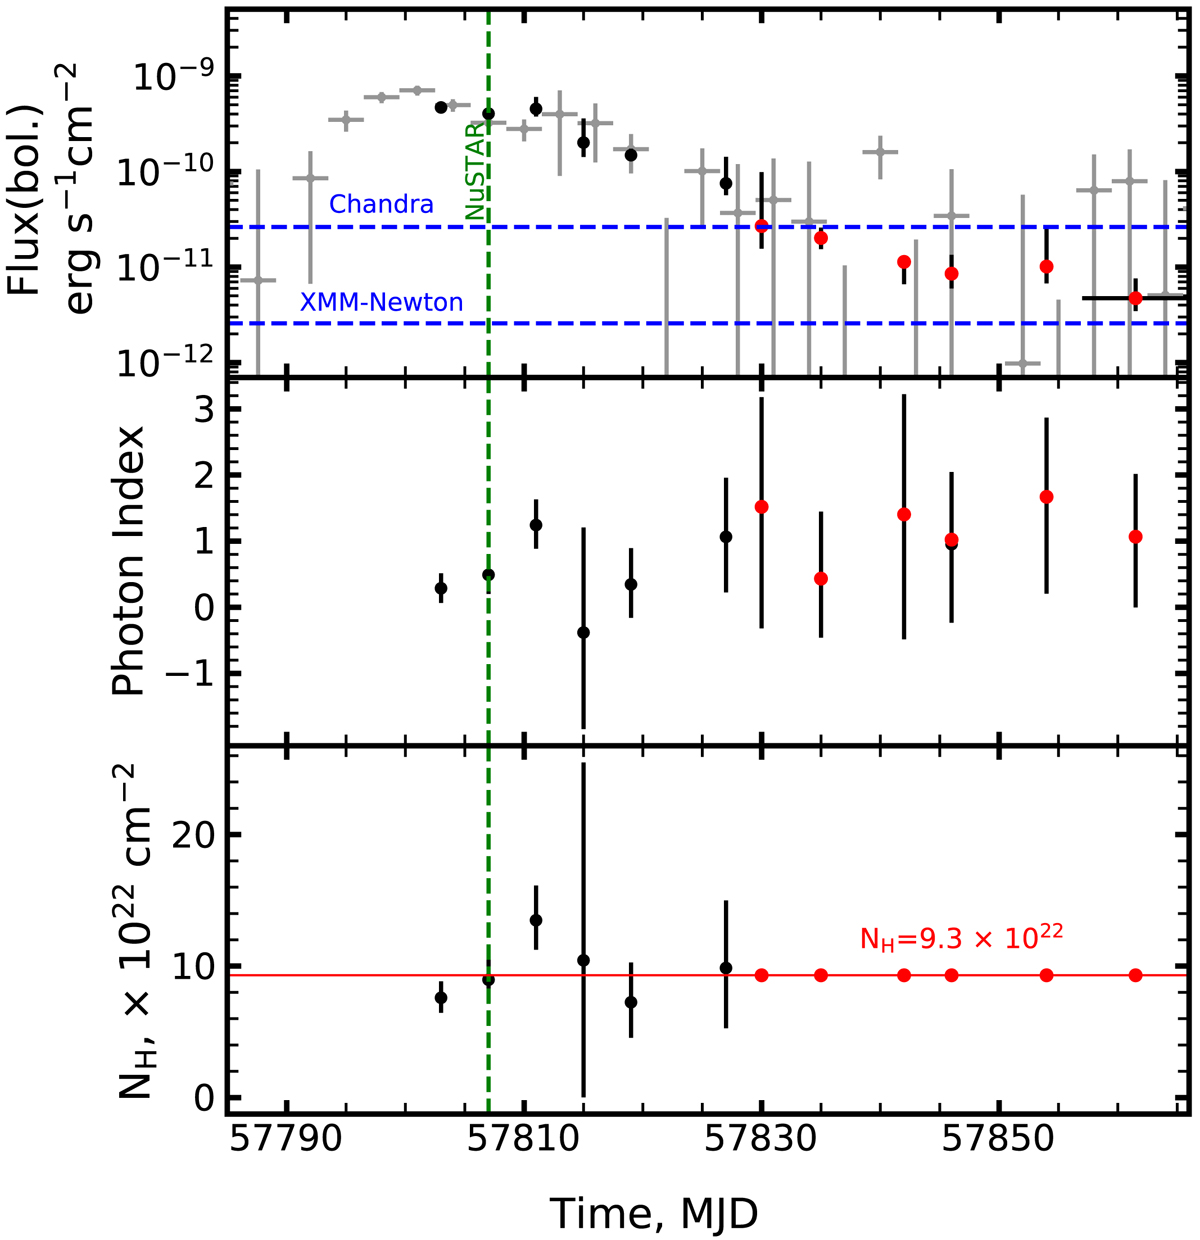
Top panel: bolometric absorption-corrected X-ray light curve of Swift J1816.7–1613 obtained by Swift/XRT in 2017. Black points correspond to individual XRT observations and the red points show the observations in which we fixed the NH at the average value of 9.3 × 1022 cm−2. Grey points represent the 3-day-averaged Swift/BAT flux in the 15–50 keV band (in arbitrary units). Middle panel: variations in the power-law photon index. Bottom panel: variations in the hydrogen column density NH. The vertical green line indicates the date of our NuSTAR observation.
Current usage metrics show cumulative count of Article Views (full-text article views including HTML views, PDF and ePub downloads, according to the available data) and Abstracts Views on Vision4Press platform.
Data correspond to usage on the plateform after 2015. The current usage metrics is available 48-96 hours after online publication and is updated daily on week days.
Initial download of the metrics may take a while.