Fig. 1.
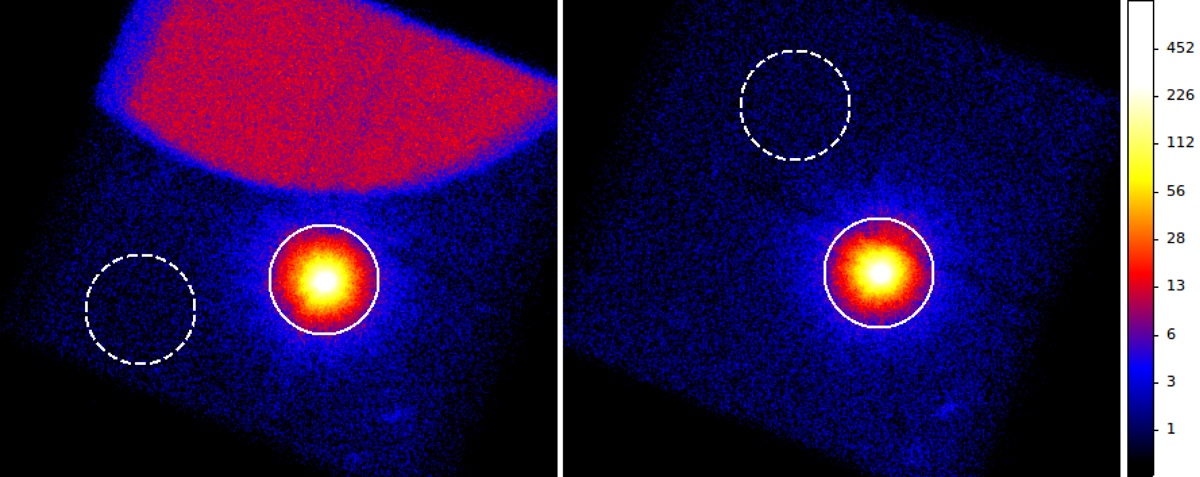
NuSTAR image of Swift J1816.7–1613 extracted from FPMA (left panel) and FPMB (right panel) in the energy range of 3–79 keV. The solid white circles are the source extraction regions of radius 100″ and the dashed white circles are the background regions of the same radius which were selected from the source-free regions. The colour bar on the right hand side shows the number of counts per pixel.
Current usage metrics show cumulative count of Article Views (full-text article views including HTML views, PDF and ePub downloads, according to the available data) and Abstracts Views on Vision4Press platform.
Data correspond to usage on the plateform after 2015. The current usage metrics is available 48-96 hours after online publication and is updated daily on week days.
Initial download of the metrics may take a while.