Fig. A.1.
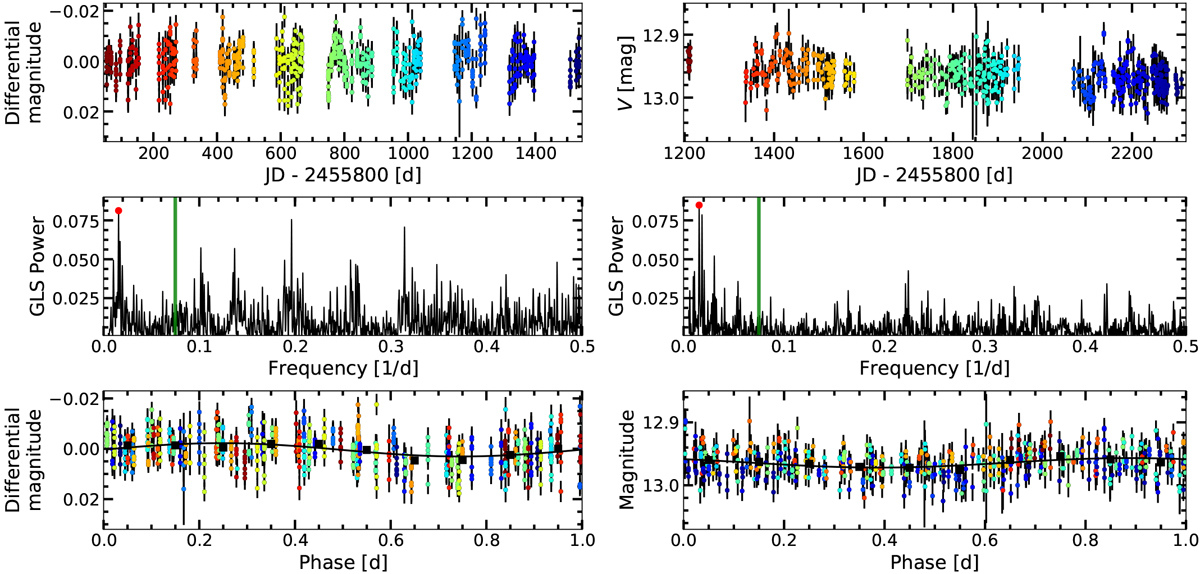
Rotation period analysis using MEarth (left panel) and ASAS-SN (right panel) photometric data. Top panel: RG715 broadband light curve (left panel) and V band light curve (right panel). The color of the datapoints indicates the observation epoch. Middle panel: GLS periodograms. The vertical green lines represent the orbital period of the planet at 13.35 days and the red dots the peak with the highest power at 63.9 days (left panel) and 64.7 days (right panel). Bottom panel: phased light curves using the rotationperiod derived from the GLS. The black curves show the best-fit sinusoidal models with an amplitude of 2.64 mmag (left panel) and 7.53 mmag (right panel). The black squares indicate the mean magnitude in ten equidistant bins in phase.
Current usage metrics show cumulative count of Article Views (full-text article views including HTML views, PDF and ePub downloads, according to the available data) and Abstracts Views on Vision4Press platform.
Data correspond to usage on the plateform after 2015. The current usage metrics is available 48-96 hours after online publication and is updated daily on week days.
Initial download of the metrics may take a while.