Fig. 6.
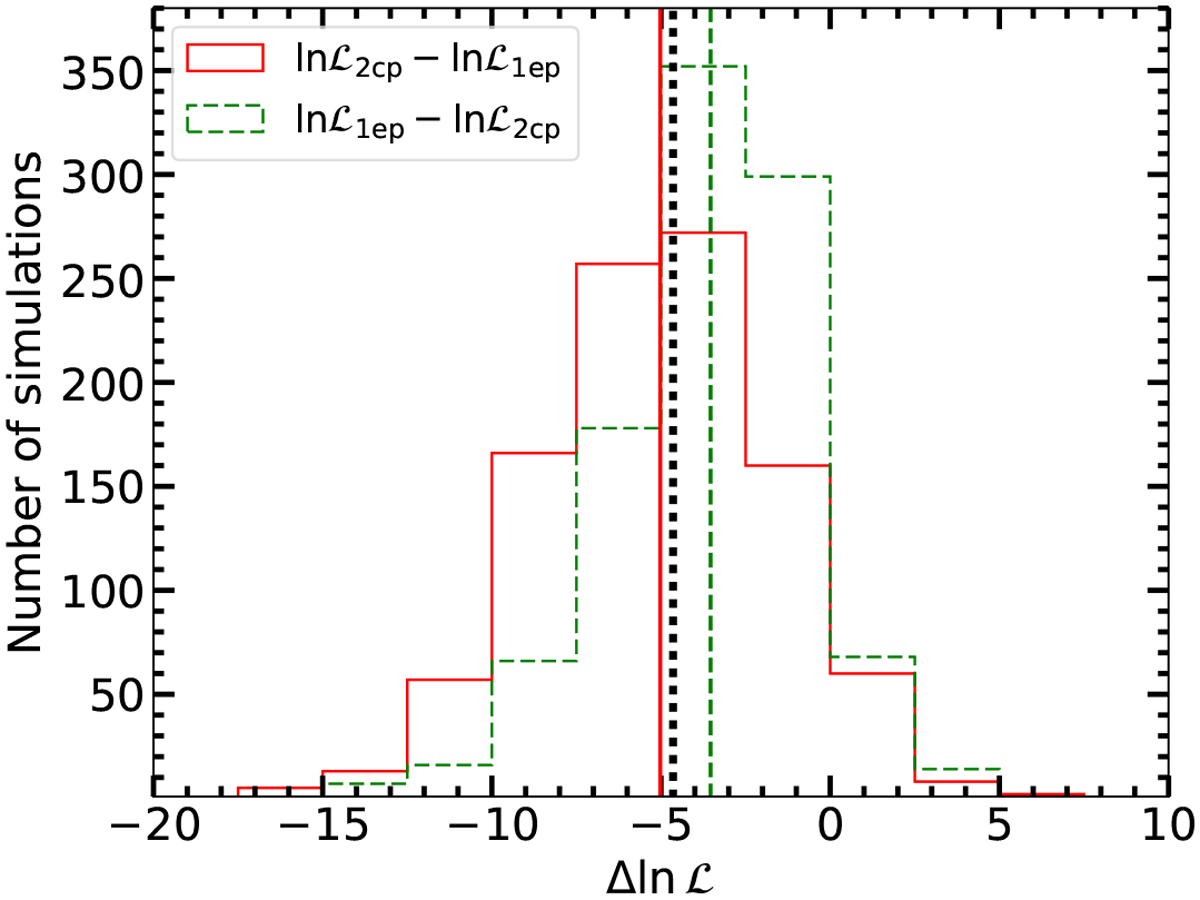
Histograms of the likelihood ratio using simulated data sets based on the best-fit eccentric single-planet model (solid red) and the circular two-planet model (dashed green). The vertical solid red line and the dashed green line represent the median values of the histograms. The black dotted vertical line represents the measured likelihood ratio
![]() .
.
Current usage metrics show cumulative count of Article Views (full-text article views including HTML views, PDF and ePub downloads, according to the available data) and Abstracts Views on Vision4Press platform.
Data correspond to usage on the plateform after 2015. The current usage metrics is available 48-96 hours after online publication and is updated daily on week days.
Initial download of the metrics may take a while.