Fig. 3.
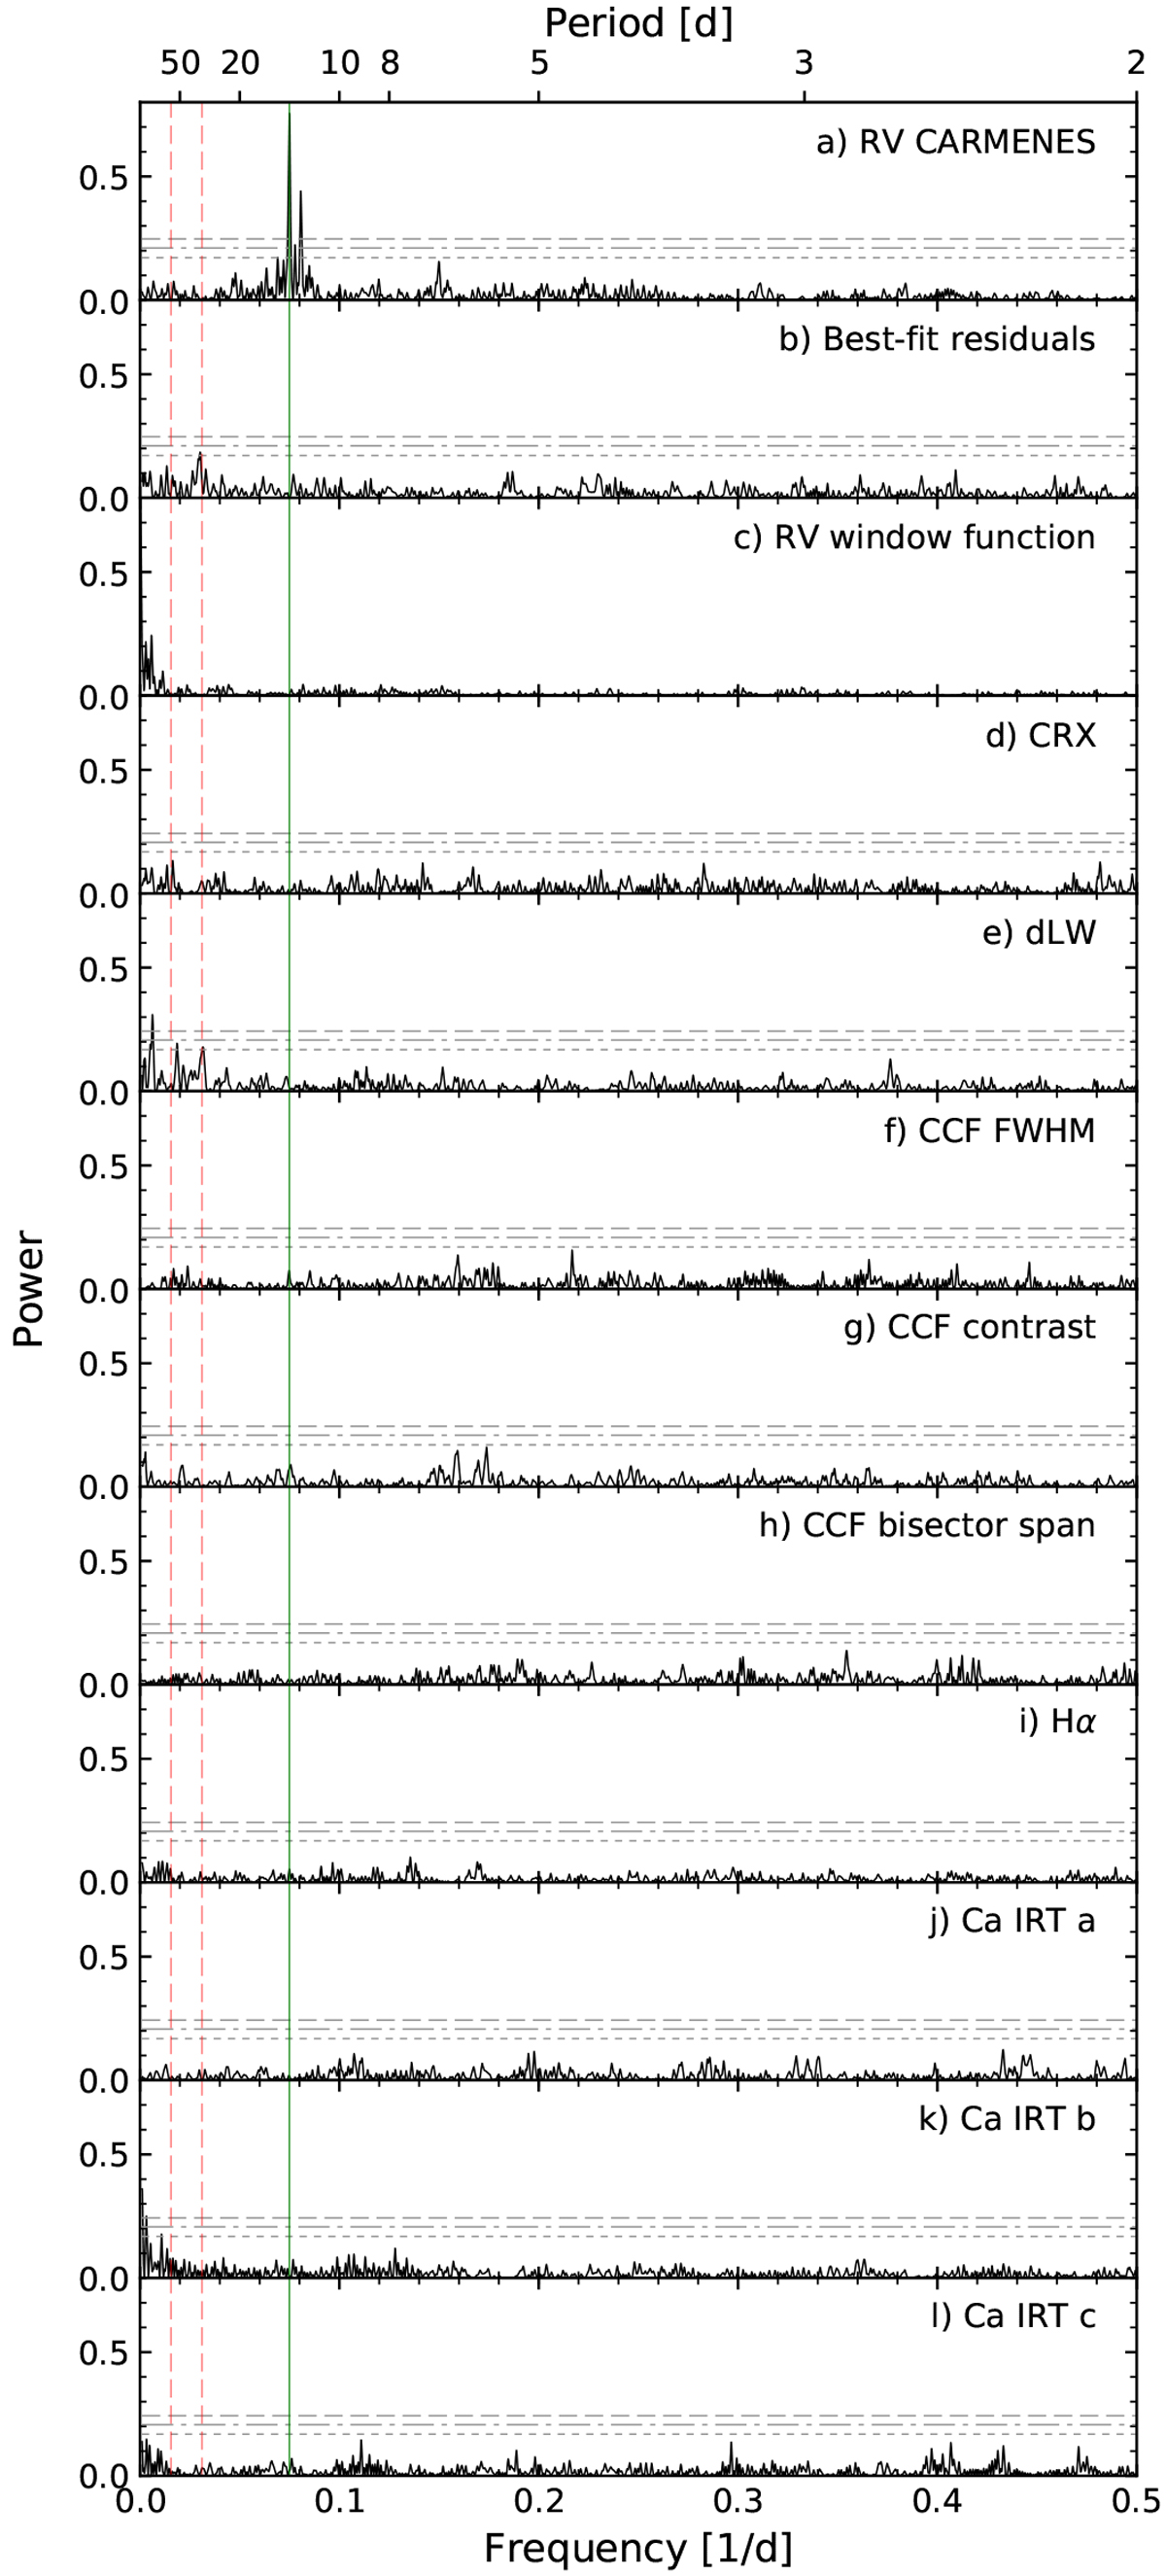
GLS periodograms of GJ 4276. Panel a: periodogram of the CARMENES RVs. The horizontal lines (dotted, dash-dotted, dashed) indicate FAP levels of 10%, 1%, and 0.1%. The vertical green line marks the orbital period with the highest power at 13.347 d. The left red dashed line at Prot = 64.3 d (frot = 0.0156 d−1) shows the weighted mean of the photometrically derived stellar rotation period and the right red dashed line its first harmonic (2frot = 0.0311 d−1). Panel b: periodogram of the residuals after removing the best-fit single-planet Keplerian with eccentricity (see Sect. 4.2.2) signal; panel c: window function of the RV data. Panels d–h: periodograms of the chromatic RV index (CRX), differential line width (dLW), as well as FWHM, contrast, and bisector span from the CCF analysis. Panels i–l: periodograms of the chromospheric line indices of Hα and Ca II IRT.
Current usage metrics show cumulative count of Article Views (full-text article views including HTML views, PDF and ePub downloads, according to the available data) and Abstracts Views on Vision4Press platform.
Data correspond to usage on the plateform after 2015. The current usage metrics is available 48-96 hours after online publication and is updated daily on week days.
Initial download of the metrics may take a while.