Fig. 1.
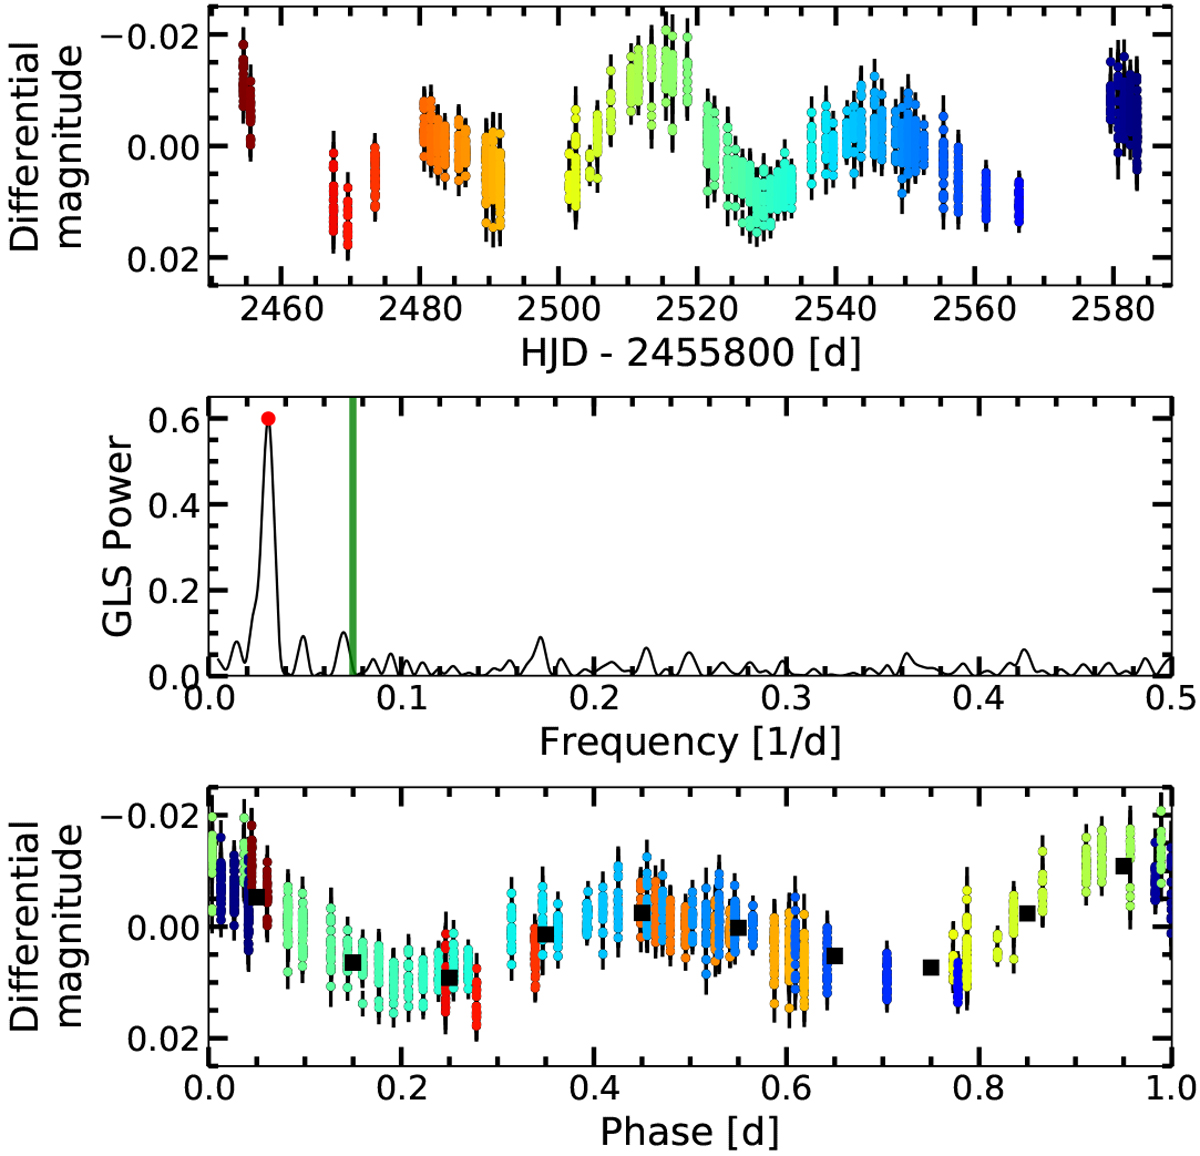
Rotation period analysis using SNO photometric data. Top panel: V band light curve. The color of the datapoints indicates the observation epoch. Middle panel: GLS periodogram. The vertical green line represents the orbital period of the planet at 13.35 days and the red dot the peak with the highest power at 32.3 days. Bottom panel: phased light curve using twice the period derived from the GLS. The black squares indicate the mean magnitude in ten equidistant bins in phase.
Current usage metrics show cumulative count of Article Views (full-text article views including HTML views, PDF and ePub downloads, according to the available data) and Abstracts Views on Vision4Press platform.
Data correspond to usage on the plateform after 2015. The current usage metrics is available 48-96 hours after online publication and is updated daily on week days.
Initial download of the metrics may take a while.