Fig. 2.
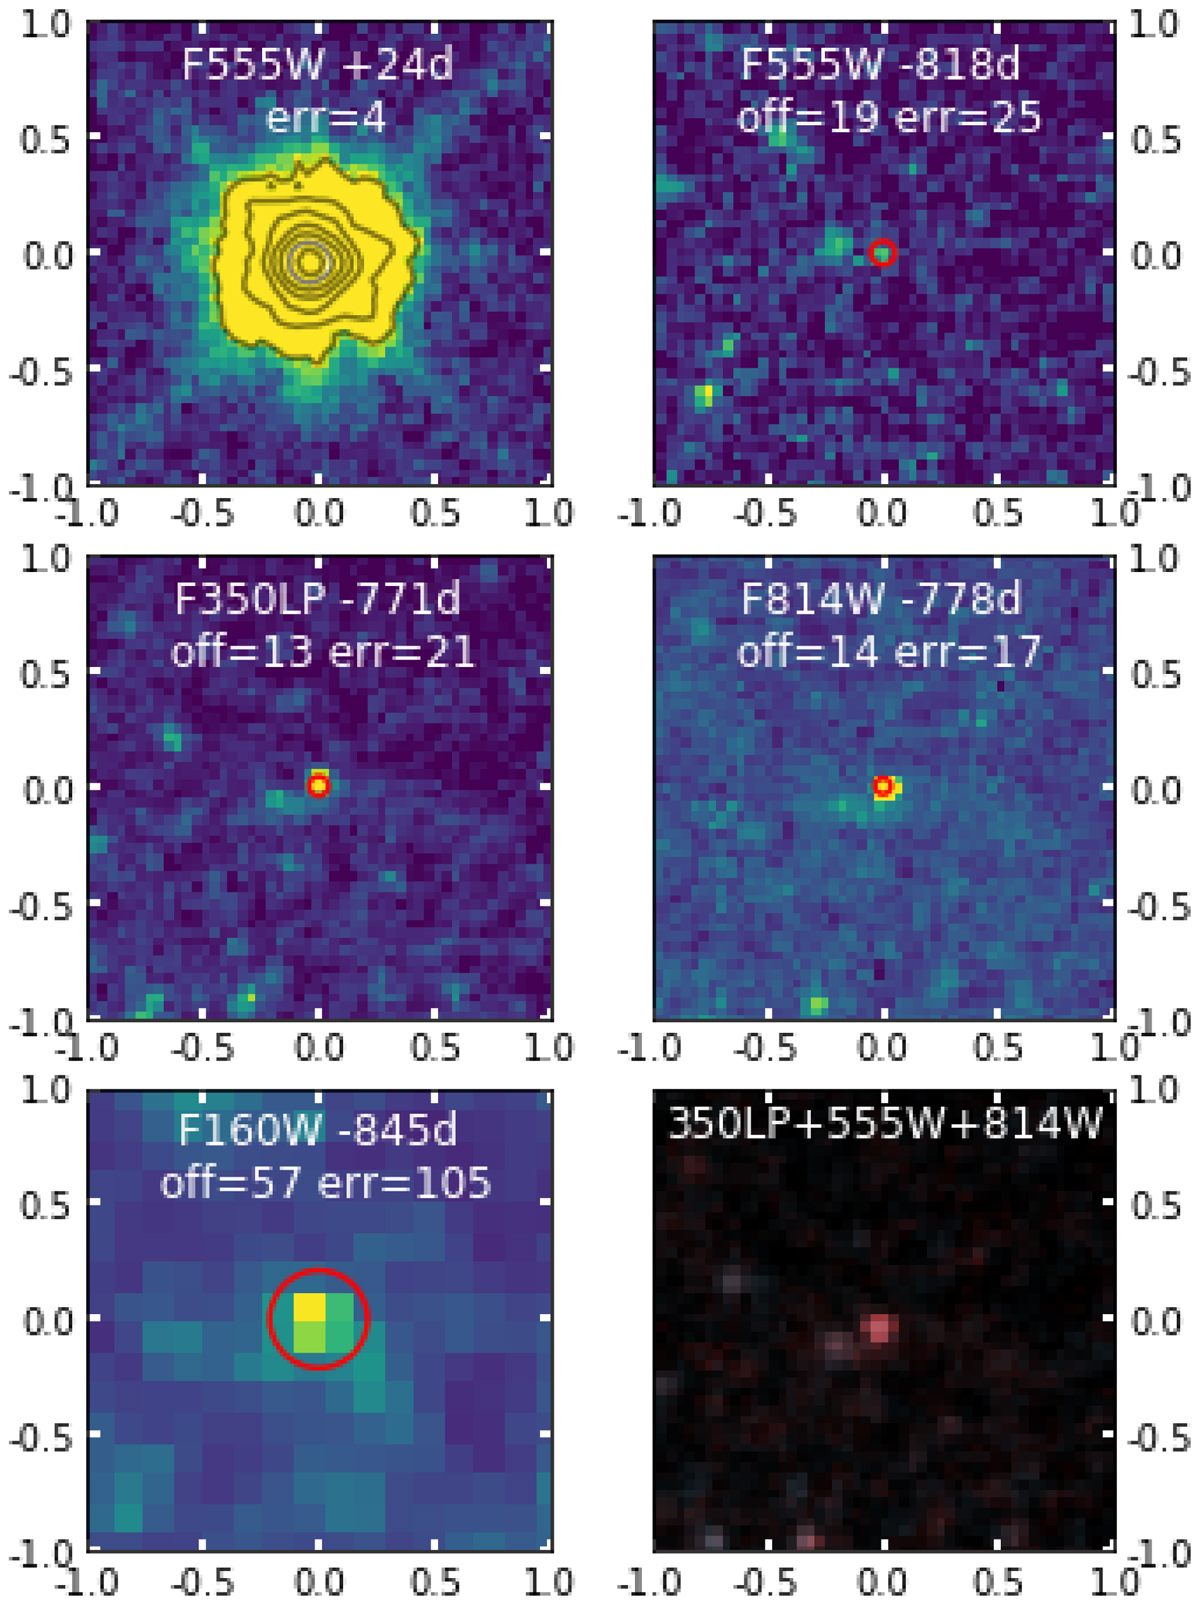
Top left panel: 2″ × 2″ HST/WFC3 image stamps. It shows SN 2018aoq at an epoch of 24 d after explosion while all others show pre-explosion images (Table A.3). The filter and epoch are labelled. The offset between the star and SN position, and the associated positional error (in mas) is also indicated. The centroid of the SN position, as measured from the image in the top left panel, is shown with a red circle, the radius of which is twice the uncertainty in the position for clarity. The limiting and absolute magnitudes for the progenitor in each filter are mF555W > 28.0 (−3.3), mF350LP > 26.8 (−4.5), mF814W > 26.0 (−5.3), and mF160W > 24.1 (−7.2).
Current usage metrics show cumulative count of Article Views (full-text article views including HTML views, PDF and ePub downloads, according to the available data) and Abstracts Views on Vision4Press platform.
Data correspond to usage on the plateform after 2015. The current usage metrics is available 48-96 hours after online publication and is updated daily on week days.
Initial download of the metrics may take a while.