Fig. 1.
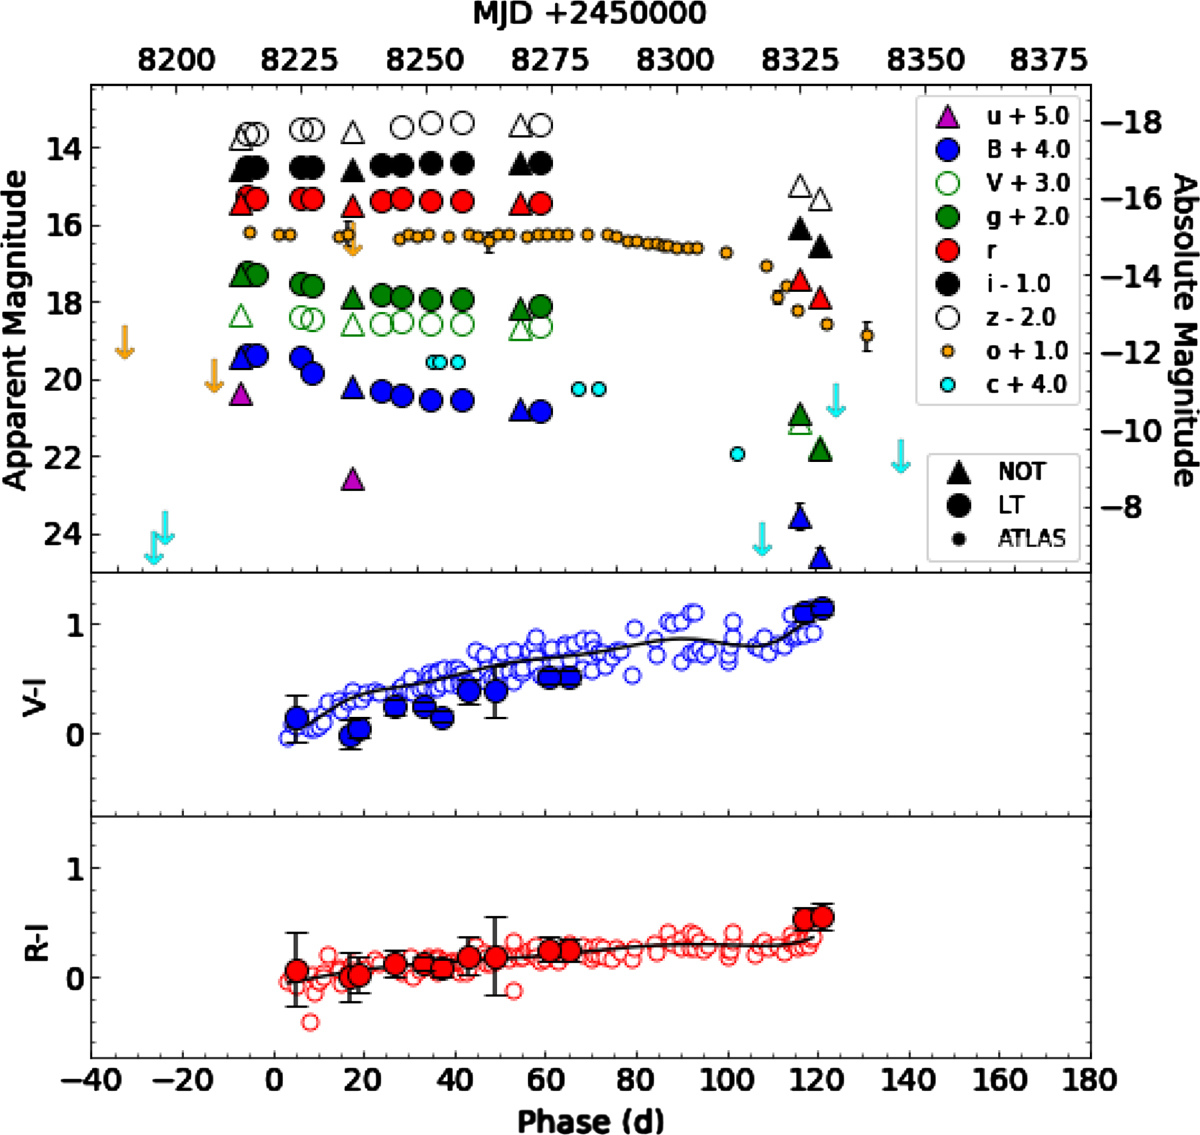
Top panel: light curves of SN 2018aoq in various filters. Upper limits are indicated by downward pointing arrows. The letters “c” and “o” indicate the “cyan” (λeff ∼ 5330 Å) and “orange” (λeff ∼ 6790 Å) ATLAS filters, respectively. The non-detection (>18.85 mag) on 2018 March 28 (MJD = 58206) allows us to constrain the rise time to ≲5 d. Bottom panel: extinction-corrected V − I and R − I colour evolution for SN 2018aoq. The errors are the result of compounding errors in transforming from the V, r, and i filters to Johnson R and I. Open circles are extinction-corrected values taken from 8 well-sampled type IIP SNe (Table A.6). The black line indicates a fit to these data from which we infer E(B − V) = 0.04 for SN 2018aoq.
Current usage metrics show cumulative count of Article Views (full-text article views including HTML views, PDF and ePub downloads, according to the available data) and Abstracts Views on Vision4Press platform.
Data correspond to usage on the plateform after 2015. The current usage metrics is available 48-96 hours after online publication and is updated daily on week days.
Initial download of the metrics may take a while.