Fig. 20.
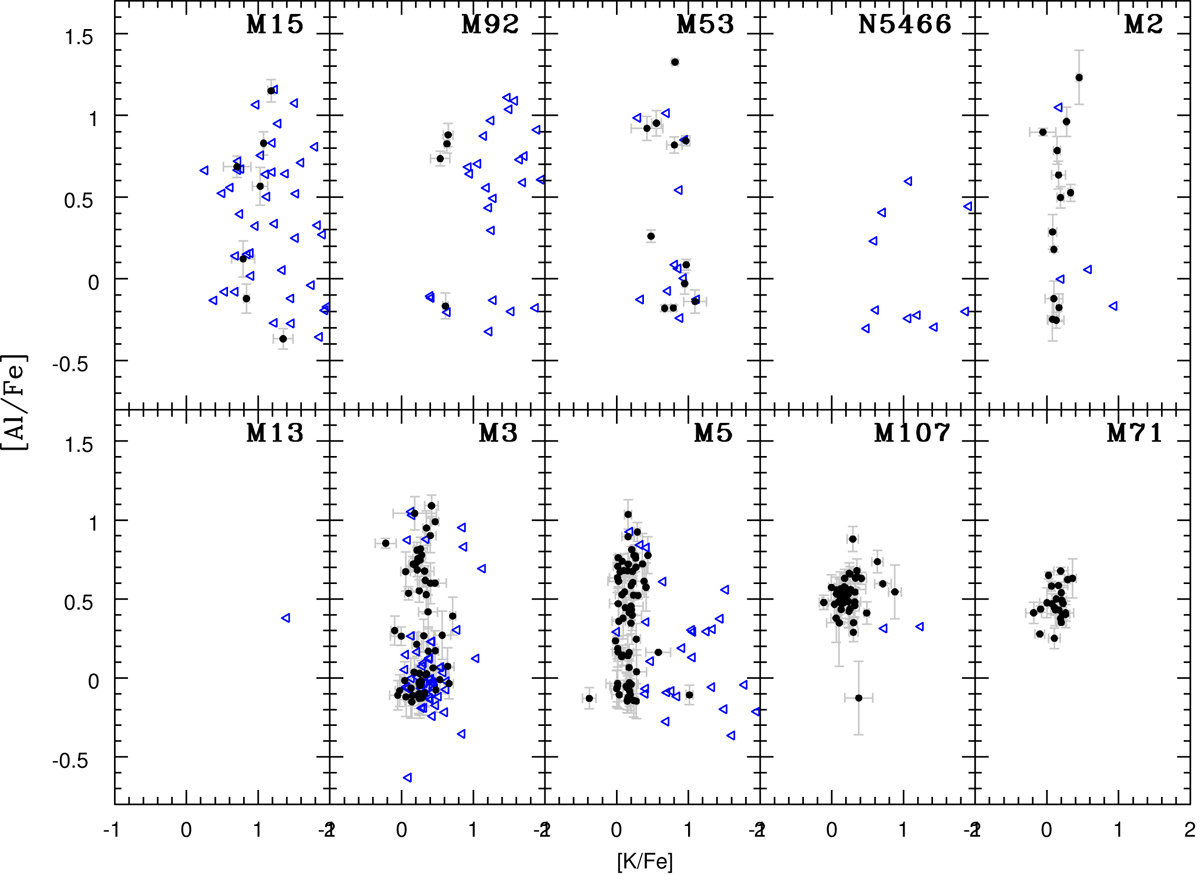
Al abundances as functions of K abundances for all GCs in our sample. Blue triangles indicate upper limits in K. While K is difficult to measure in very low-metallicity GCs, there is no significant spread in the remaining GCs. M 13 does not contain measurements because the K lines at the cluster doppler shift fall in a APOGEE CCD gap where no measurement can be made.
Current usage metrics show cumulative count of Article Views (full-text article views including HTML views, PDF and ePub downloads, according to the available data) and Abstracts Views on Vision4Press platform.
Data correspond to usage on the plateform after 2015. The current usage metrics is available 48-96 hours after online publication and is updated daily on week days.
Initial download of the metrics may take a while.