Free Access
Fig. 19.
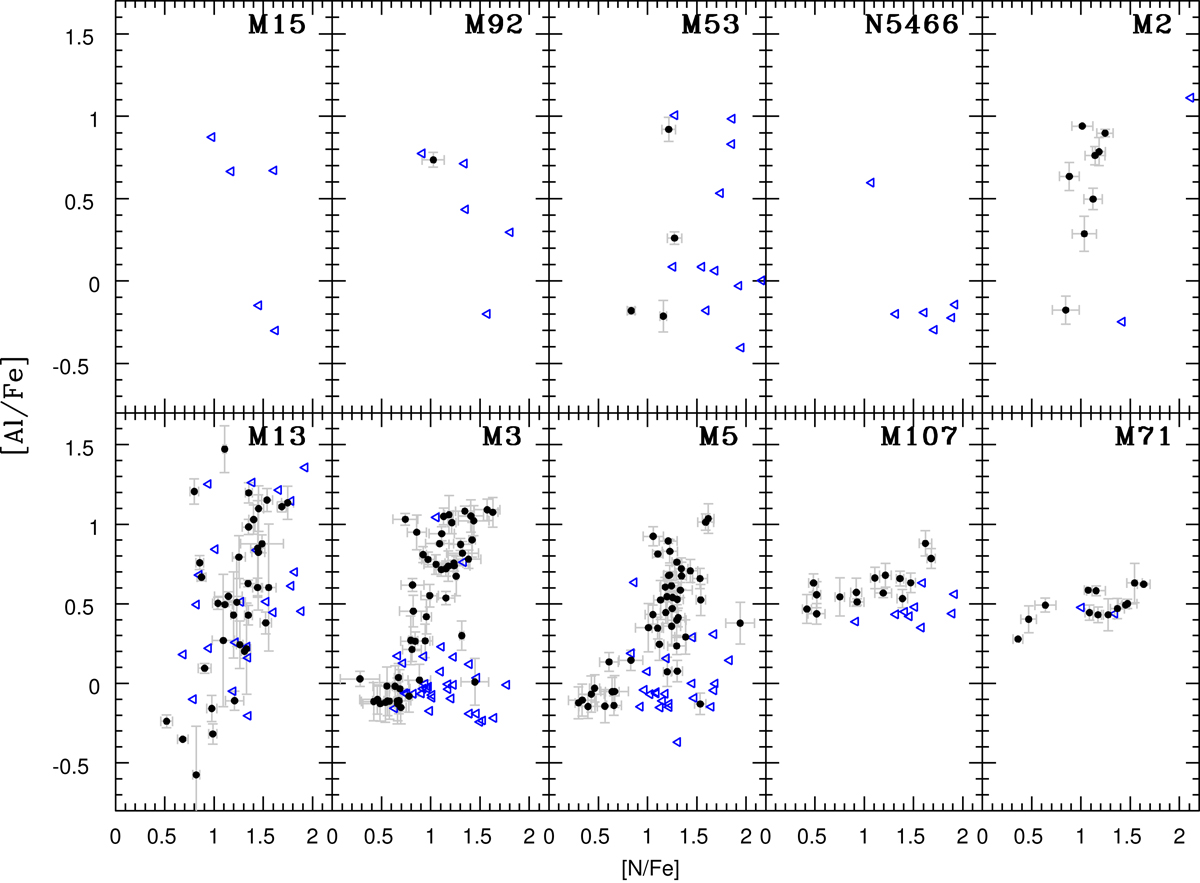
Al abundances as functions of N abundances for all the clusters sorted by metallicity. Blue triangles indicate upper limits in N. Al and N are correlated, but the Al spread is decreasing with increasing metallicity.
Current usage metrics show cumulative count of Article Views (full-text article views including HTML views, PDF and ePub downloads, according to the available data) and Abstracts Views on Vision4Press platform.
Data correspond to usage on the plateform after 2015. The current usage metrics is available 48-96 hours after online publication and is updated daily on week days.
Initial download of the metrics may take a while.