Fig. 6.
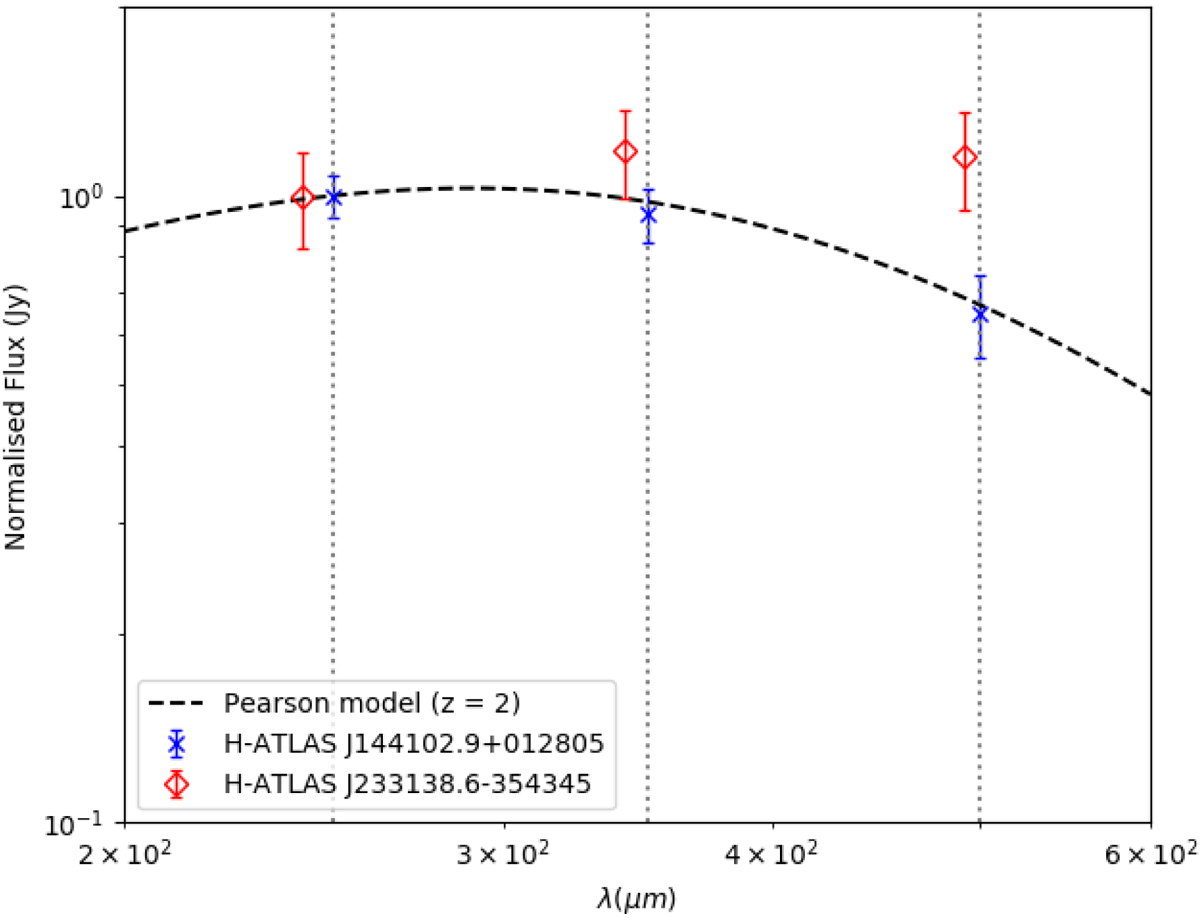
Normalized SED from Pearson et al. (2013), as defined in Eq. (3), at z = 2 in contrast with the normalized tabulated fluxes at 250, 350 and 500 μm (vertical dotted) of two H-ATLAS sources at zMMF = 2: one (J144102.9+012805) that fits well to the model and other one (J233138.6−354345), whose points have been slightly displaced in x-axis to get better clarity, that does not fit properly to the model according to our criteria.
Current usage metrics show cumulative count of Article Views (full-text article views including HTML views, PDF and ePub downloads, according to the available data) and Abstracts Views on Vision4Press platform.
Data correspond to usage on the plateform after 2015. The current usage metrics is available 48-96 hours after online publication and is updated daily on week days.
Initial download of the metrics may take a while.