Fig. 2.
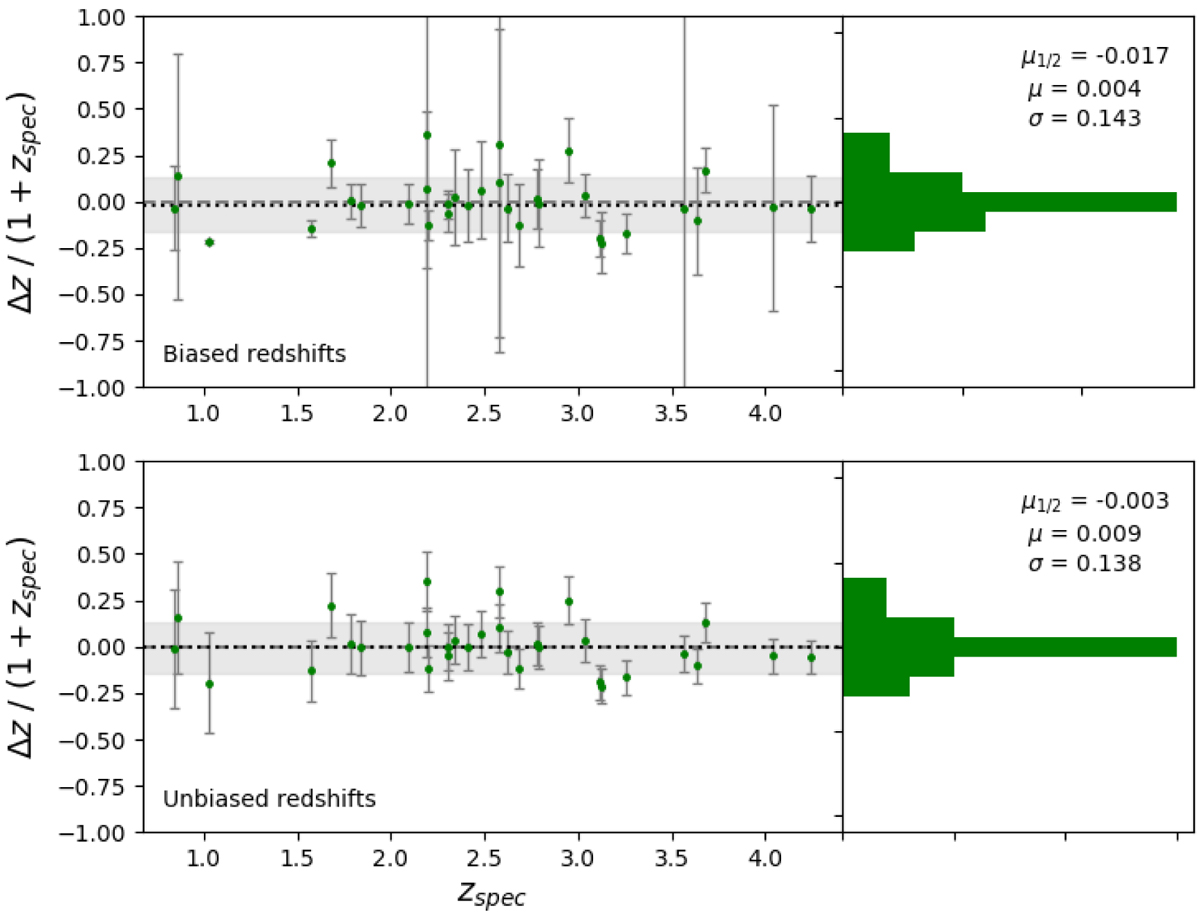
Difference, Δz/(1 + zspec), as a function of zspec between the biased (top) or unbiased (bottom) photometric redshifts estimated with our matched multifilter (MMF) and the spectroscopic redshifts from sources in Table 1. The statistical parameters noted illustrate the systematic overestimates or underestimates, mean μ and median μ1/2, and the degree of scatter, σ, of the photometric redshifts (![]() and
and ![]() ) found using the MMF and the Pearson et al. (2013) SED. Error bars in the top panel are calculated from using Eqs. (1) and 3) while error bars in the bottom panel are derived from simulations described in Sect. 4. The gray band depicts the 1σ region centered in the median μ1/2 value for each distribution.
) found using the MMF and the Pearson et al. (2013) SED. Error bars in the top panel are calculated from using Eqs. (1) and 3) while error bars in the bottom panel are derived from simulations described in Sect. 4. The gray band depicts the 1σ region centered in the median μ1/2 value for each distribution.
Current usage metrics show cumulative count of Article Views (full-text article views including HTML views, PDF and ePub downloads, according to the available data) and Abstracts Views on Vision4Press platform.
Data correspond to usage on the plateform after 2015. The current usage metrics is available 48-96 hours after online publication and is updated daily on week days.
Initial download of the metrics may take a while.