Fig. 7.
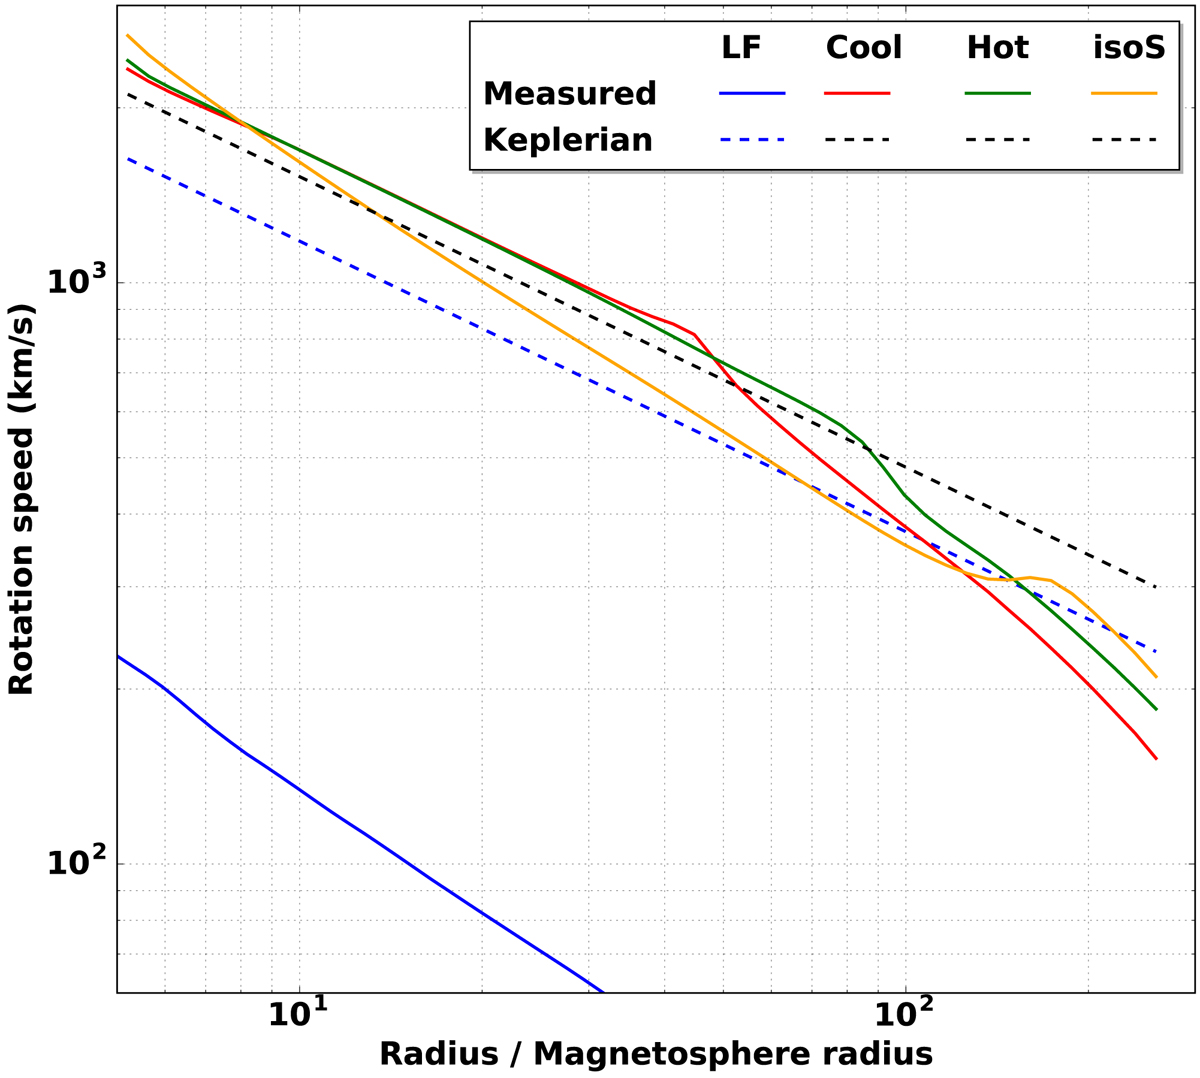
Longitudinal velocity profiles in the orbital plane as a function of the distance to the accretor measured in units of the magnetosphere radius given in Eq. (5). The velocities of the LF (blue) and HS configurations (red, green and yellow) are measured once the numerically relaxed state is reached and averaged over the longitudinal angles. The measured velocity profiles (solid lines) are compared to the Keplerian profiles expected for a thin disk around the light and the heavy NS in dashed blue and dashed black, respectively.
Current usage metrics show cumulative count of Article Views (full-text article views including HTML views, PDF and ePub downloads, according to the available data) and Abstracts Views on Vision4Press platform.
Data correspond to usage on the plateform after 2015. The current usage metrics is available 48-96 hours after online publication and is updated daily on week days.
Initial download of the metrics may take a while.