Fig. 4
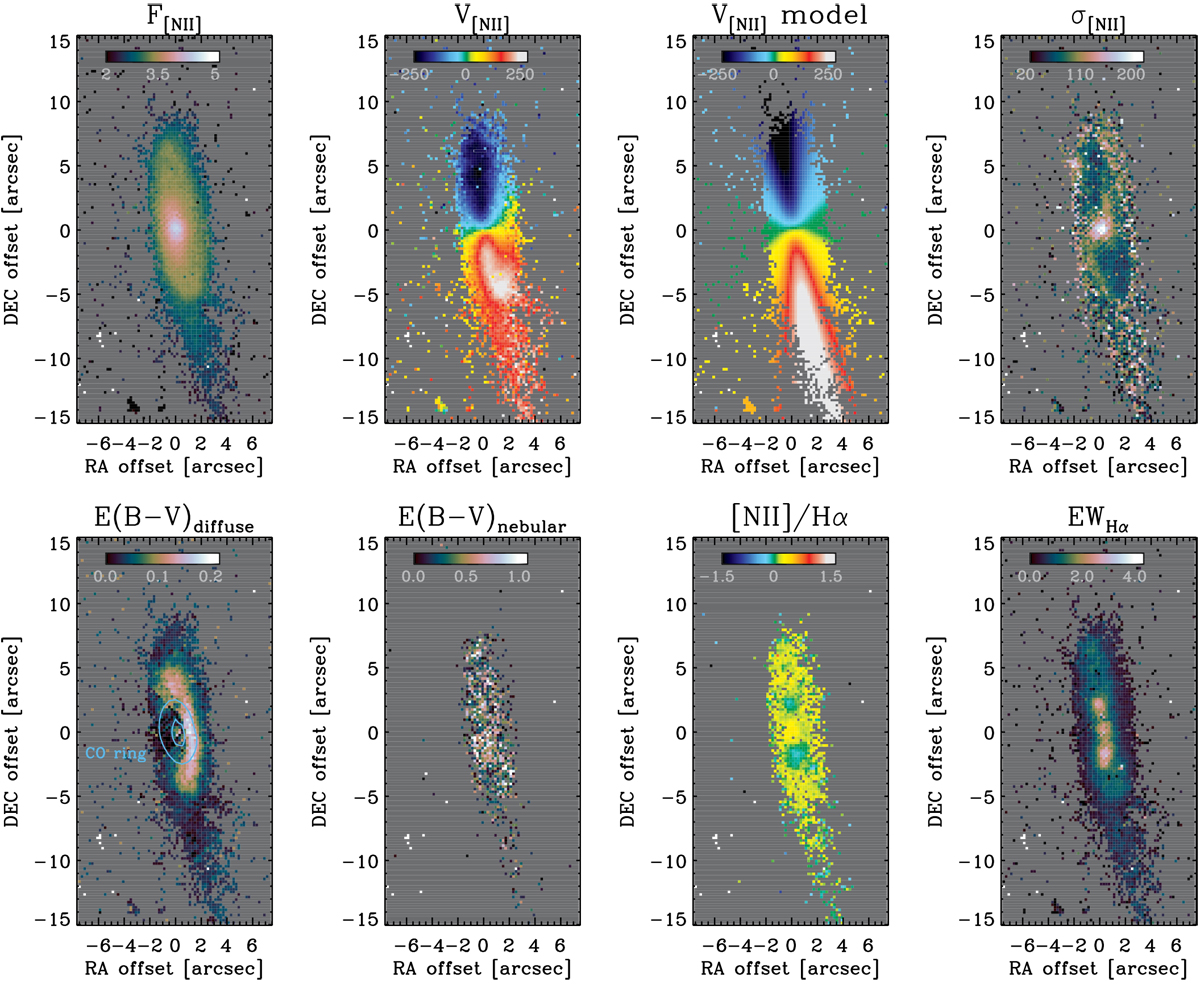
Ionised gas in FCC 167. Top left panel: surface brightness (in log scale) of the [NII] λ6583 line already highlighting a tail of ionised gas connecting to the main reservoir. Top second panel: velocity map indicating organised motion along the major axis; there are several additional kinematic features towards the outskirts. Top third panel: an axisymmetric kinematic model of the measured velocity map. Top right panel: velocity dispersion of the [NII] line showing a central peak and hints of a spiral-like shape. Bottom left panel: reddening, E(B − V), by diffuse dust (as opposed to emission-line reddening) derived from the spectral fitting. Blue contours correspond to molecular gas emission measured by ALMA (see Fig. 5). Bottom second panel: reddening, E(B − V), of the emission lines which is much stronger than the diffuse reddening component, and without any distinct features. Bottom third and right panels show the [NII]/Hα line ratio and Hα EW, respectively. Together these two maps indicate low level star formation inside the dust ring and nuclear ionisation due to an AGN.
Current usage metrics show cumulative count of Article Views (full-text article views including HTML views, PDF and ePub downloads, according to the available data) and Abstracts Views on Vision4Press platform.
Data correspond to usage on the plateform after 2015. The current usage metrics is available 48-96 hours after online publication and is updated daily on week days.
Initial download of the metrics may take a while.