Fig. 2
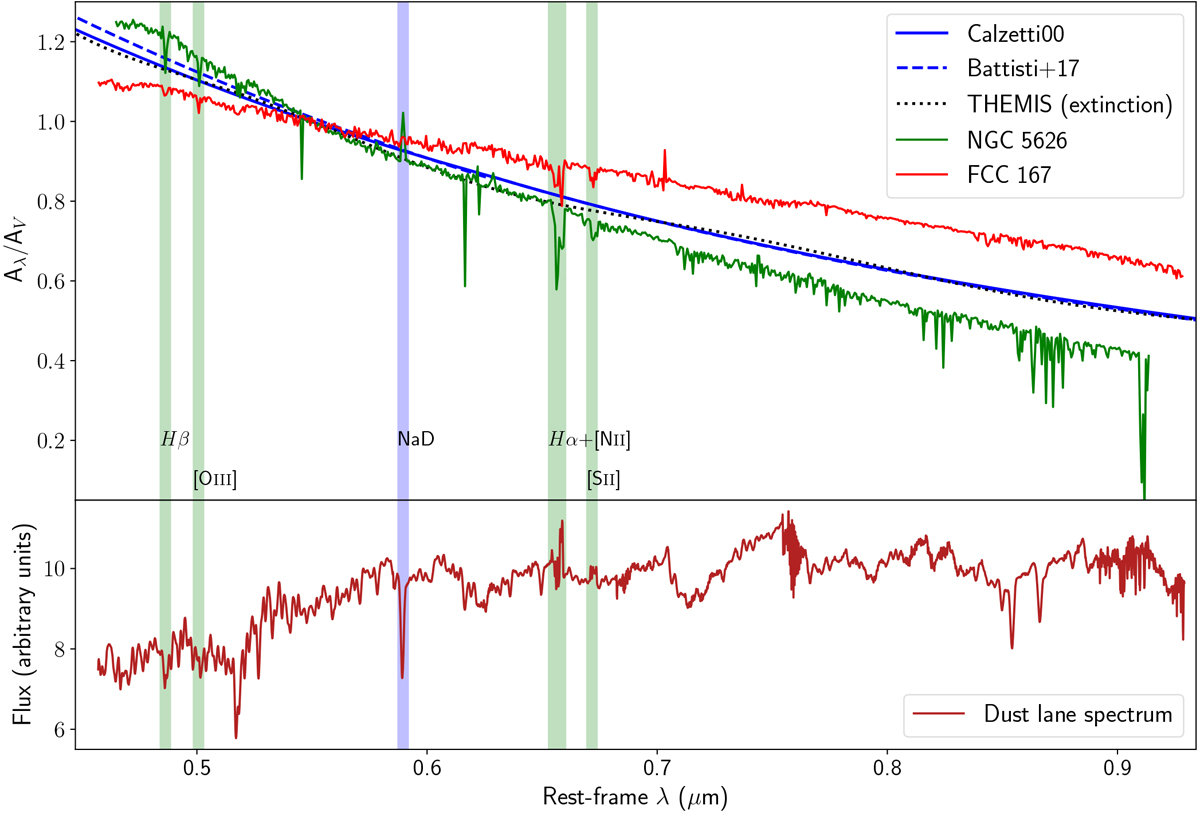
Spectrally resolved attenuation curve for FCC 167 (red line, this work) and for NGC 5626 (green line, Viaene et al. 2017a). Three reference curves are plotted: The Calzetti et al. (2000) and Battisti et al. (2017) average attenuation curves for different samples of galaxies (blue solid and dashed line, respectively) and the THEMIS extinction curve (black dotted line). All curves are normalised to the V -band central wavelength; AV = 0.35 for FCC 167. For reference, the emission spectrum of the dust lane area is shown in the bottom panel. Several important emission lines (shaded green) and the NaD absorption line (shaded purple) are highlighted as well.
Current usage metrics show cumulative count of Article Views (full-text article views including HTML views, PDF and ePub downloads, according to the available data) and Abstracts Views on Vision4Press platform.
Data correspond to usage on the plateform after 2015. The current usage metrics is available 48-96 hours after online publication and is updated daily on week days.
Initial download of the metrics may take a while.