Fig. 1
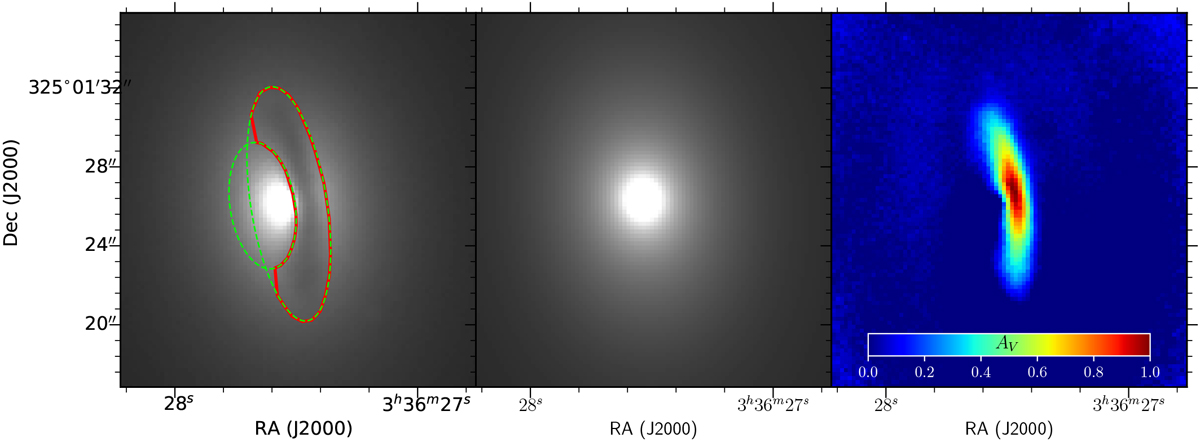
Different stages of the MGE modelling to produce attenuation maps for every wavelength slice of the MUSE datacube. Left panel: reconstructed image at 5509 Å (the V -band central wavelength). The green ellipses indicate the inner and outer edge of the dust lane (red contour). Middle panel: corresponding dust-free MGE model fit. Right panel: attenuation map at 5509 Å obtained from Eq. (1).
Current usage metrics show cumulative count of Article Views (full-text article views including HTML views, PDF and ePub downloads, according to the available data) and Abstracts Views on Vision4Press platform.
Data correspond to usage on the plateform after 2015. The current usage metrics is available 48-96 hours after online publication and is updated daily on week days.
Initial download of the metrics may take a while.