Fig. 8.
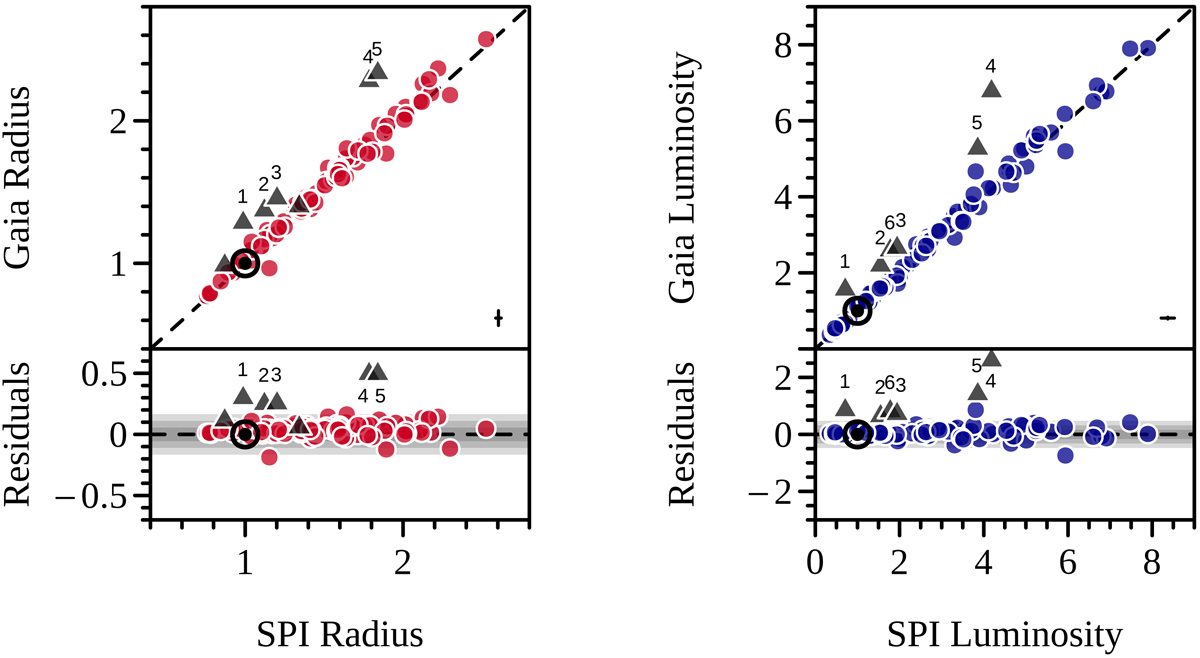
Comparison of stellar radii (left panel) and luminosities (right panel) in solar units from Gaia observations against those from stellar modeling using the SPI pipeline. Typical uncertainties are shown as error bars in the lower right corners. Each shade of gray in the residual plots represents an average 1σ, ranging from one to three. Stars with estimates significantly different at the σ > 3 level are shown as gray triangles. Stars which are outliers in more than one panel are labeled. We note the differences in scale between the left and right panels. The biases in the residuals are consistent with zero (−0.056 ± 0.091 R⊙ and −0.14 ± 0.36 L⊙).
Current usage metrics show cumulative count of Article Views (full-text article views including HTML views, PDF and ePub downloads, according to the available data) and Abstracts Views on Vision4Press platform.
Data correspond to usage on the plateform after 2015. The current usage metrics is available 48-96 hours after online publication and is updated daily on week days.
Initial download of the metrics may take a while.