Fig. 4.
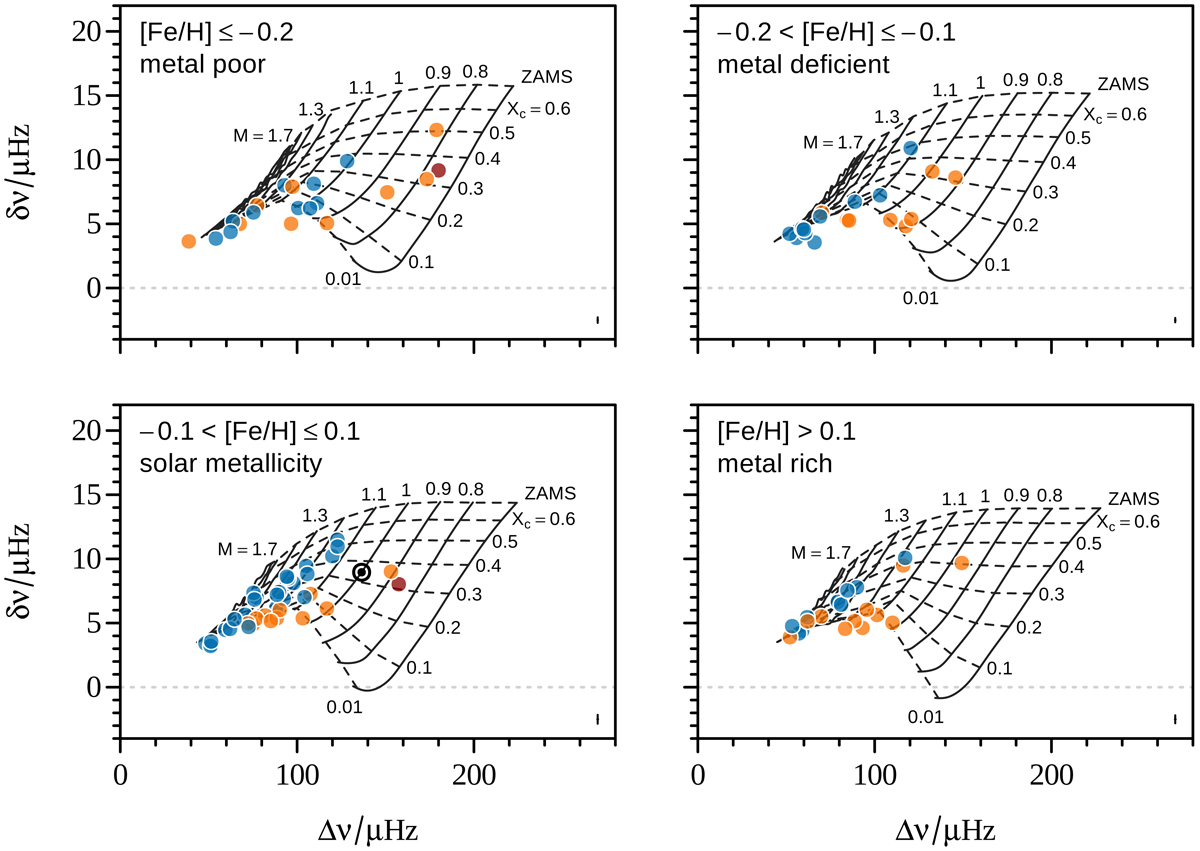
CD diagram showing asteroseismic measurements – the small frequency separation δν and the large frequency separation Δν – for the sample of 97 solar-like stars studied here. The panels are arranged by metallicity. The points are colored by spectral type: F (blue, Teff > 6000 K), G (orange, 6000 ≥ Teff > 5200 K), K (red, Teff ≤ 5200 K). The cross in the bottom right corner of each panel shows typical uncertainties (see also Fig. 5). The dotted light gray line indicates where δν = 0. The solid lines trace theoretical tracks of stellar evolution, with each track labeled along the top by its mass (in solar units) and connected by the dashed lines that are spaced in core-hydrogen abundance (Xc).
Current usage metrics show cumulative count of Article Views (full-text article views including HTML views, PDF and ePub downloads, according to the available data) and Abstracts Views on Vision4Press platform.
Data correspond to usage on the plateform after 2015. The current usage metrics is available 48-96 hours after online publication and is updated daily on week days.
Initial download of the metrics may take a while.