Free Access
Fig. A.1.
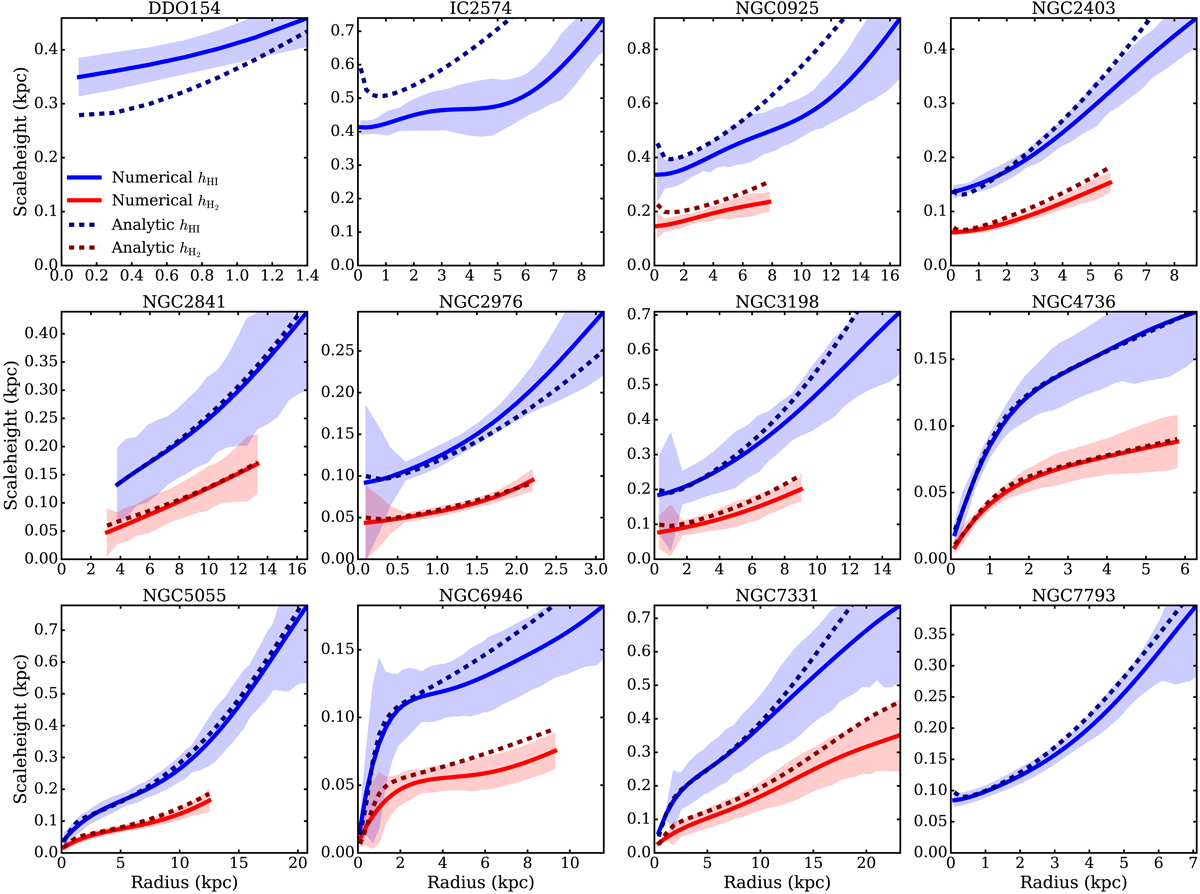
Comparison of the scale heights calculated by Eq. (A.4) (dashed line) and by GALPYNAMICS (solid line). The HI and H2 scale heights are in blue and red, respectively.
Current usage metrics show cumulative count of Article Views (full-text article views including HTML views, PDF and ePub downloads, according to the available data) and Abstracts Views on Vision4Press platform.
Data correspond to usage on the plateform after 2015. The current usage metrics is available 48-96 hours after online publication and is updated daily on week days.
Initial download of the metrics may take a while.