Fig. 6.
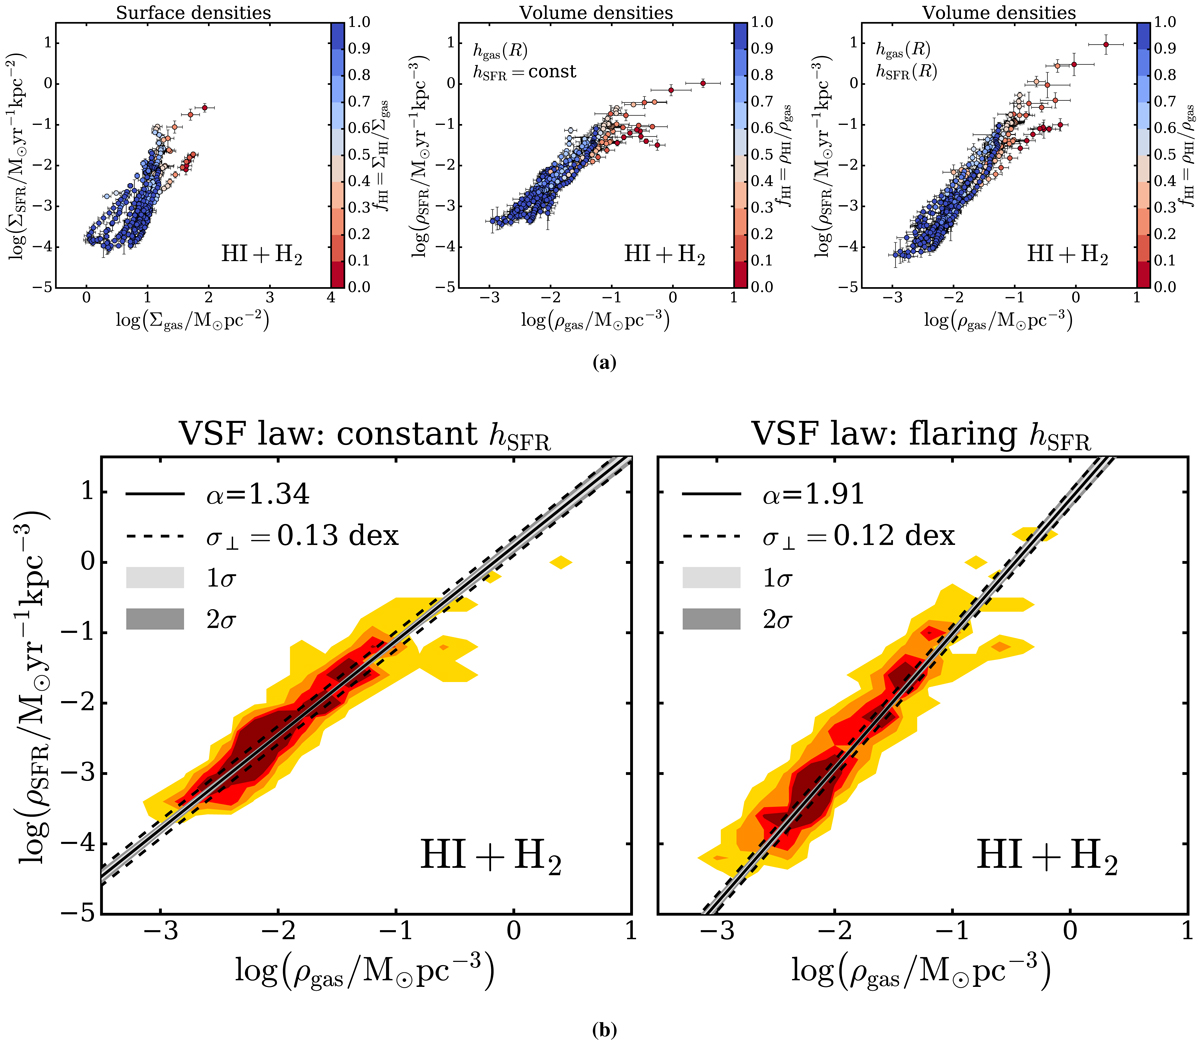
Upper row: same as Fig. 5b but the points are colour-coded according to the HI fraction; blue and red points come from HI and H2 dominated regions, respectively. The VSF law appears tight and straight even if only HI-dominated regions are considered. Lower row: VSF law between total gas and SFR. The solid black line is the best-fit relation with slope α and orthogonal intrinsic scatter σ⊥ (dashed lines). The grey bands show 1σ and 2σ uncertainties on the fit. In the left panel, ρSFR is calculated with the constant hSFR, while in the right panel hSFR(R) flares with radius (Eq. (17)). The volume densities radial profiles are shown as contours containing 95% (yellow), 75% (orange), 50% (red), and 25% (dark red) of the data points.
Current usage metrics show cumulative count of Article Views (full-text article views including HTML views, PDF and ePub downloads, according to the available data) and Abstracts Views on Vision4Press platform.
Data correspond to usage on the plateform after 2015. The current usage metrics is available 48-96 hours after online publication and is updated daily on week days.
Initial download of the metrics may take a while.